- **Reduced Revenue:** Amazon famously found that every 100ms increase in page
load time cost them about 1% in sales (1). Sluggish endpoints aren’t just an
inconvenience; they hit the bottom line.
- **Higher Bounce Rates:** According to Google, over half of mobile users abandon
a site if it takes longer than three seconds to load (2). Users today expect speed
and smoothness from the start.
- **Decreased Engagement and Trust:** Akamai’s research highlights that a two-second
delay in web page load time can cause bounce rates to skyrocket (3). Slow, error-prone
services send a message of unreliability to your users, this can rapidly
translate into loss of trust in your products.
1. Greg Linden’s Slides from Amazon on the cost of latency: *Marissa Mayer at Web 2.0*
2. Google, *The Need for Mobile Speed: How Mobile Page Speed Impacts Customer Engagement* (2018)
3. Akamai, *Akamai Online Retail Performance Report* (2017)
**What does this mean for you?** By injecting faults and testing
resiliency scenarios early with fault, you’re investing in a smoother launch,
happier users, healthier on-calls and a product that stands strong under
real-world conditions. Postponing issues discovery late means they’re
costlier and more stressful to fix.
## Rethinking How We Build Software
Traditionally, developers focus on crafting features and fixing bugs, leaving
resilience concerns to be uncovered later by SREs, performance engineers, or end
users in production. fault challenges this status quo by inviting developers to
think differently about the resilience of their applications. This isn’t just a
shift in tools; it’s a shift in philosophy.
We want to help you move beyond a mindset where reliability is an afterthought.
Instead, imagine it as a first-class concern in your day-to-day coding routine,
as natural as running unit tests or linting your code. By experimenting with
realistic fault conditions before your application gets delivered and deployed,
you’re developing a healthier culture of forward-thinking and robust engineering.
### New Indicators of Reliability
How can we talk about reliability in a way that resonates with developers? We
propose a set of new indicators that highlight different angles of resilience:
- **Latency Tolerance**: How gracefully does your application handle slow
network responses? Identifying how long it can wait before timing out or
degrading service helps you set meaningful SLOs (Service Level Objectives).
- **Failure Surface Awareness**: By injecting HTTP errors, packet loss, or
bandwidth constraints, you gain clarity on where your code is most fragile.
Measuring how many parts of your service break under each condition provides
a new perspective on your "failure surface."
- **Retry Overhead**: Discover the hidden costs of your application’s recovery
strategies. Do you retry too aggressively, wasting resources and time?
Tracking how your code responds to fault scenarios reveals whether your
fallback paths are efficient or need fine-tuning.
- **Resilience Debt**: Like technical debt, resilience debt accumulates when you
postpone reliability fixes. Early detection and quantification of this debt
helps prioritize improvements before they become expensive production
firefights.
### A Daily Practice, Not a Crisis Response
Think of fault as a steady practice in your development cadence. Just as TDD
(Test-Driven Development) encourages writing tests first, we envision a
Reliability-First Development approach: write a feature, inject a fault, and see
how it holds up. Adjust, refine, and proceed with a clearer understanding of how
your software behaves under stress.
This shift in mindset encourages you to proactively craft solutions that don’t
just work in ideal conditions. Over time, this practice becomes muscle memory,
and resilience testing transforms from an occasional chore into an integral part
of building and delivering products.
fault isn’t just another tool on your belt; it’s a new way of thinking about and
measuring reliability. We’re here to help you see beyond happy paths, to embrace
uncertainty early, and to raise the bar on what "done" really means.
---
fault is about making your life easier when it comes to building reliable
software. It puts you in the driver’s seat, letting you explore and solidify the
resilience of your applications before those big, stressful moments can occur.
---
# Code Review
This guide will introduces you to generating code change suggestions, from an
angle of resilience and reliability, using LLM.
The proposed changes are proposed as unified diff that help you visualize
what fault suggests you may want to add or remove from your code.
!!! abstract "Prerequisites"
- [X] Install fault
If you haven’t installed fault yet, follow the
[installation instructions](../install.md).
- [X] Get an OpenAI Key
For the purpose of the guide, we will be using OpenAI models. You
need to create an API key. Then make sure the key is available for
fault:
```bash
export OPENAI_API_KEY=sk-...
```
- [X] Install a local qdrant database
fault uses [qdrant](https://qdrant.tech/) for its vector database. You
can install a [local](https://qdrant.tech/documentation/quickstart/),
free, qdrant using docker:
```bash
docker run -p 6333:6333 -p 6334:6334 -v "$(pwd)/qdrant_storage:/qdrant/storage:z" qdrant/qdrant
```
!!! danger "Windows not supported"
Unfortunately, the {==agent==} feature is not supported on Windows because
the framework used by fault to interact with LLM does not support that
platform.
!!! info "Experimental feature"
This feature is still experimental and is subject to change. Dealing with
LLM requires accepting a level of fuzzyness and adjustments. Engineering
is still very much a human endeavour!
!!! question "Is this a MCP agent tool?"
The feature describe in this guide is not a [MCP tool](./mcp-tools.md).
Instead it's a CLI feature that queries the LLM of your choice for
an analysis of your source code.
## Review a Python Web Application
In this scenario we take a very basic Python application, using the
FastAPI and SQLAlchemy (sqlite) libraries. We want to learn what we can
from this application.
- [X] Source code of the application
```python title="webapp/app.py"
#!/usr/bin/env -S uv run --script
# /// script
# dependencies = [
# "uvicorn",
# "fastapi[standard]",
# "sqlalchemy"
# ]
# ///
###############################################################################
#
# Very basic application that expose a couple of endpoints that you can
# use to test fault.
# Once you have installed `uv` https://docs.astral.sh/uv/, simply run the
# application as follows:
#
# uv run --script app.py
#
###############################################################################
from typing import Annotated
import uvicorn
from fastapi import FastAPI, HTTPException, Depends, status, Body
from sqlalchemy import create_engine, Column, Integer, String
from sqlalchemy.orm import declarative_base, sessionmaker, Session
from sqlalchemy.exc import SQLAlchemyError
###############################################################################
# Database configuration
###############################################################################
engine = create_engine("sqlite:///./test.db")
SessionLocal = sessionmaker(autocommit=False, autoflush=False, bind=engine)
Base = declarative_base()
###############################################################################
# Data model
###############################################################################
class User(Base):
__tablename__ = "users"
id = Column(Integer, primary_key=True, index=True)
name = Column(String, index=True)
password = Column(String)
Base.metadata.create_all(bind=engine)
###############################################################################
# Dependency injection
###############################################################################
def get_db():
db = SessionLocal()
try:
yield db
finally:
db.close()
###############################################################################
# Our application
###############################################################################
app = FastAPI(servers=[{"url": "http://localhost:9090"}])
@app.get("/")
async def index() -> dict[str, str]:
return {"message": "Hello, World!"}
@app.post("/users/")
async def create_user(
name: Annotated[str, Body()],
password: Annotated[str, Body()],
db: sessionmaker[Session] = Depends(get_db)
):
db_user = User(name=name, password=password)
db.add(db_user)
db.commit()
db.refresh(db_user)
return db_user
@app.get("/users/{user_id}")
async def read_user(
user_id: int, db: sessionmaker[Session] = Depends(get_db)
):
try:
user = db.query(User).filter(User.id == user_id).first()
if user is None:
raise HTTPException(status_code=status.HTTP_404_NOT_FOUND)
return user
except SQLAlchemyError as e:
raise HTTPException(status_code=status.HTTP_500_INTERNAL_SERVER_ERROR)
if __name__ == "__main__":
uvicorn.run("app:app", port=9090)
```
You may now install the dependencies to run it:
=== "pip"
```bash
pip install fastapi[standard] sqlalchemy uvicorn
```
=== "uv"
```bash
uv tool install fastapi[standard] sqlalchemy uvicorn
```
Finally, run the application as follows:
```bash
cd webapp
fastapi dev --port 9090
```
This application has only a couple of endpoints is purposefully not
optimised.
- [X] Generate a scenario for this application
We must first generate and run a scenario so we get a mapping of the
application.
```bash
fault scenario generate --scenario scenario.yaml --spec-url http://localhost:9090/openapi.json
```
- [X] Run the scenario against this application
```bash
fault scenario run --scenario scenario.yaml
```
- [X] Review the code and make suggestions
fault reviews the code by chunking it, indexing it and then asking your
favourite LLM for its opinion.
```bash
fault agent code-review \
--results results.json \ # (1)!
--source-dir webapp/ \ # (2)!
--source-lang python # (3)!
⠸ [00:00:34] Reviewing! This could take a while...
> index__get [GET http://localhost:9090/]
create_user_users__post [POST http://localhost:9090/users/]
read_user_users__user_id__get [GET http://localhost:9090/users/{user_id}]
[↑↓ to move, enter to select, type to filter]
```
1. The results from the previous scenario execution
2. The top-level directory where the application's code lives
3. The application's language (someday a heuristic will guess this)
4. Use the arrow keys to select the endpoint you want to review and patch
Assuming we select the first endpoint, fault suggests the following changes:
??? example "Generated code review changes report"
Below is a set of targeted, small‐scope changes you can drop almost verbatim into your `app.py` to dramatically improve resilience, prevent cascading slow‐downs, and give you early warning via metrics and tracing. Each change is explained, and I’ve ordered them by immediate impact.
---
## 1) Increase and tune your DB-connection pool
Right now you are using SQLite’s default pool (QueuePool size=5). Under even moderate latency or I/O hiccups you’ll saturate your pool and stall new requests forever.
```diff
--- a/app.py
+++ b/app.py
@@ ### Database configuration
-engine = create_engine("sqlite:///./test.db")
+engine = create_engine(
+ "sqlite:///./test.db",
+ # allow up to 10 concurrent connections
+ pool_size=10,
+ # and burst to 20 before failing
+ max_overflow=10,
+ # wait up to 5s for a free connection
+ pool_timeout=5,
+)
SessionLocal = sessionmaker(autocommit=False, autoflush=False, bind=engine)
```
**Why:** prevents "head of line" blocking when one connection is slow (disk I/O hiccup, GC pause, etc.).
---
## 2) Bound every DB call with a per-request timeout
Even with a bigger pool, a hung query will hold its slot indefinitely. Wrapping your sync calls in `asyncio.to_thread` + `asyncio.wait_for` guarantees a hard cap.
```diff
--- a/app.py
+++ b/app.py
import asyncio
from fastapi import HTTPException, status
from sqlalchemy.exc import SQLAlchemyError
+# helper that runs sync code in a thread
+def _sync_read_user(db, user_id: int):
+ user = db.query(User).filter(User.id == user_id).first()
+ if user is None:
+ raise HTTPException(status_code=status.HTTP_404_NOT_FOUND, detail="user not found")
+ return user
@app.get("/users/{user_id}")
async def read_user(
user_id: int, db: sessionmaker[Session] = Depends(get_db)
):
- try:
- user = db.query(User).filter(User.id == user_id).first()
- if user is None:
- raise HTTPException(status_code=status.HTTP_404_NOT_FOUND)
- return user
- except SQLAlchemyError as e:
- raise HTTPException(status_code=status.HTTP_500_INTERNAL_SERVER_ERROR)
+ try:
+ # cap the entire DB roundtrip at 2s
+ return await asyncio.wait_for(
+ asyncio.to_thread(_sync_read_user, db, user_id),
+ timeout=2.0,
+ )
+ except asyncio.TimeoutError:
+ # fast‐fail slow queries
+ raise HTTPException(status_code=status.HTTP_504_GATEWAY_TIMEOUT, detail="DB request timed out")
+ except SQLAlchemyError:
+ # catch transient DB errors
+ raise HTTPException(status_code=status.HTTP_500_INTERNAL_SERVER_ERROR, detail="DB error")
```
**Why:** prevents a black-hole or very slow query from chewing your entire worker pool and pushing p95 latency off the charts.
---
## 3) Add idempotent retries with exponential back-off to your GET
`read_user` is idempotent. A retry on a transient DB or I/O error will hide packet drops, brief database locks, file-system stalls, etc.
1. Install [`tenacity`](https://github.com/jd/tenacity):
```bash
pip install tenacity
```
2. Wrap the in-thread helper:
```diff
--- a/app.py
+++ b/app.py
from tenacity import (
retry,
retry_if_exception_type,
wait_exponential,
stop_after_attempt,
)
+# retry only on SQLALchemy transient errors
@retry(
retry=retry_if_exception_type(SQLAlchemyError),
wait=wait_exponential(multiplier=0.1, max=1.0),
stop=stop_after_attempt(3),
reraise=True,
)
def _sync_read_user(db, user_id: int):
@@
user = db.query(User).filter(User.id == user_id).first()
if user is None:
raise HTTPException(status_code=status.HTTP_404_NOT_FOUND, detail="user not found")
return user
```
**Why:** this will re-try on deadlocks, brief locks, dropped packets, without touching your route signature or calling code.
---
## 4) Instrument basic Prometheus metrics + tracing
Early warning is critical: track latencies, error rates and retry counts so you can alert before your users notice.
1. Install:
```bash
pip install prometheus-client starlette_exporter opentelemetry-api opentelemetry-sdk opentelemetry-instrumentation-fastapi
```
2. Add to the top of `app.py`:
```python
from starlette_exporter import PrometheusMiddleware, handle_metrics
from prometheus_client import Counter, Histogram
from opentelemetry import trace
from opentelemetry.sdk.trace import TracerProvider
from opentelemetry.sdk.trace.export import BatchSpanProcessor, ConsoleSpanExporter
# -- tracing -----------------------------------------------------------------
trace.set_tracer_provider(TracerProvider())
trace.get_tracer_provider().add_span_processor(
BatchSpanProcessor(ConsoleSpanExporter())
)
tracer = trace.get_tracer(__name__)
# -- metrics -----------------------------------------------------------------
app.add_middleware(PrometheusMiddleware)
app.add_route("/metrics", handle_metrics)
REQUEST_LATENCY = Histogram(
"http_request_latency_seconds", "Latencies by method and path",
["method", "endpoint"],
)
REQUEST_COUNT = Counter(
"http_requests_total", "Total requests by method, path and status",
["method", "endpoint", "http_status"],
)
@app.middleware("http")
async def metrics_middleware(request, call_next):
labels = {"method": request.method, "endpoint": request.url.path}
with REQUEST_LATENCY.labels(**labels).time():
response = await call_next(request)
REQUEST_COUNT.labels(
**labels, http_status=response.status_code
).inc()
return response
```
**Why:** you’ll immediately see tail-latency spikes (p95/p99), error surges, retry storms or pool-timeouts in your dashboards.
---
## 5) (Optional) Circuit-breaker for sustained failures
When your DB goes down for more than a few seconds, retries only amplify pressure. A circuit-breaker will short-circuit and fast-fail until the DB recovers.
```bash
pip install pybreaker
```
```diff
--- a/app.py
+++ b/app.py
from pybreaker import CircuitBreaker
# trip breaker after 5 errors, reset after 30s
db_breaker = CircuitBreaker(fail_max=5, reset_timeout=30)
-@retry(...)
-def _sync_read_user(...):
+@db_breaker
+@retry(...)
+def _sync_read_user(...):
...
```
**Why:** prevents retry avalanches against an already-failing downstream.
---
### Summary of Impact
- Pool tuning + per-call timeouts → no more "stair-step" tail-latency under slow queries.
- Idempotent retries → hide small network/DB blips.
- Metrics & tracing → proactive alerting.
- Circuit-breaker → quick fail-fast during true outages.
With these four "drop-in" changes you’ll eliminate head-of-line blocking,
dramatically reduce error SLO violations on `GET /users/{user_id}`, and gain visibility into when and why your service is struggling.
- [X] Optionally Inject Advices from Scenario Executions Analysis
You may improve the generated review by injecting the analysis made
from a scenario executed agains the source code under review. This should
give much more context to reason about.
Run an analysis from a past scenario results:
```bash
fault agent scenario-review --results results.json
```
This will generate a file called `scenario-review-report.md`. Now you can
inject this file into the code review command line:
```bash
fault agent code-review \
--results results.json \
--source-dir webapp/ \
--source-lang python \
--scenario-review-report scenario-review-report.md # (1)!
? Select the OpenAPI operationId to patch:
> read_root__get [GET http://localhost:9090/]
create_user_users__post [POST http://localhost:9090/users/]
read_user_users__user_id__get [GET http://localhost:9090/users/{user_id}]
[↑↓ to move, enter to select, type to filter]
```
1. Pass the generated report. You can omit this, if the file exists in
the current directory, it will be read.
Assuming again we select the first endpoint, fault suggests now the
following changes:
??? example "Generated code review changes report after scenario analysis"
Here are four focused, minimally-intrusive changes you can make today to dramatically improve resilience, reliability and observability in your FastAPI/SQLAlchemy app.
1. Wrap every transaction in an explicit context manager and rollback on failure
Right now you do:
```python
db.add(db_user)
db.commit()
db.refresh(db_user)
```
If `commit()` fails you never roll back, leaving the session in an invalid state. Instead use:
```python
from sqlalchemy.exc import SQLAlchemyError
@app.post("/users/")
async def create_user(
name: str = Body(...),
password: str = Body(...),
db: Session = Depends(get_db),
):
try:
# begin() will automatically rollback on exception
with db.begin():
user = User(name=name, password=password)
db.add(user)
# now safe to refresh
db.refresh(user)
return user
except SQLAlchemyError as e:
# session.rollback() already called by begin()
# you can log e here
raise HTTPException(
status_code=status.HTTP_500_INTERNAL_SERVER_ERROR,
detail="could not create user",
)
```
2. Add a simple retry with exponential back-off around commits
Transient "database is locked" errors in SQLite (and some cloud-SQL networks) can often be overcome by a retry. The [tenacity](https://github.com/jd/tenacity) library gives you a one-liner:
```bash
pip install tenacity
```
```python
from tenacity import retry, wait_exponential, stop_after_attempt
@retry(wait=wait_exponential(multiplier=0.2, max=2), stop=stop_after_attempt(3))
def safe_commit(db: Session):
db.commit()
@app.post("/users/")
async def create_user(...):
try:
with db.begin():
user = User(...)
db.add(user)
# retry commit if it hits a transient lock
safe_commit(db)
db.refresh(user)
return user
except SQLAlchemyError:
raise HTTPException(500, "db error")
```
3. Enforce a per-request timeout
A hung or extremely slow request ties up your worker. Adding a single middleware gives you a hard cap on processing time:
```python
import asyncio
from fastapi import Request
@app.middleware("http")
async def timeout_middleware(request: Request, call_next):
# 5 seconds max per request
try:
return await asyncio.wait_for(call_next(request), timeout=5.0)
except asyncio.TimeoutError:
raise HTTPException(504, "request timed out")
```
4. Add basic metrics and tracing hooks
Knowing "what just broke" is half the battle. Two minutes to add Prometheus metrics:
```bash
pip install prometheus_client
```
```python
import time
from prometheus_client import Counter, Histogram, make_asgi_app
from starlette.middleware import Middleware
from starlette.middleware.base import BaseHTTPMiddleware
REQUEST_COUNT = Counter("http_requests_total", "Request count", ["method", "endpoint", "status"])
REQUEST_LATENCY = Histogram("http_request_latency_seconds", "Latency", ["method", "endpoint"])
class MetricsMiddleware(BaseHTTPMiddleware):
async def dispatch(self, request, call_next):
start = time.time()
response = await call_next(request)
elapsed = time.time() - start
key = (request.method, request.url.path, response.status_code)
REQUEST_COUNT.labels(*key).inc()
REQUEST_LATENCY.labels(request.method, request.url.path).observe(elapsed)
return response
app.add_middleware(MetricsMiddleware)
# mount /metrics for Prometheus to scrape
app.mount("/metrics", make_asgi_app())
```
With these four changes in place you will have:
- safe transactions that always roll back on error
- automatic retries for common transient failures
- a hard deadline for every HTTP call
- real-time metrics you can hook into your alerting system
- [X] Generate a PDF version of the report
fault only generates a markdown format. You may convert it to a
PDF document using [pandoc](https://pandoc.org/). We suggest that you also
use the [Eisvogel](https://github.com/Wandmalfarbe/pandoc-latex-template)
template for a sleek rendering. Once installed, you may run a command such
as:
```bash
pandoc code-review-report.md -o code-review-report.pdf \
--listings --pdf-engine=xelatex \
--template eisvogel # (1)!
```
1. If you didn't installed the Eisvogel template, just remove this flag
!!! tip
In a future release, fault will be able to apply and try the changes
to verify they may be used safely.
# Configure fault LLM Provider
This guide will take you through configuring the LLM models for
fault
!!! abstract "Prerequisites"
- [X] Install fault
If you haven’t installed fault yet, follow the
[installation instructions](../install.md).
Make sure the `fault` binary can be found in your `PATH`.
!!! warning
This guide requires the [agent feature](../install.md#features-matrix) to
be enabled.
## Overview
fault lets you configure your agent's models via
command [line parameters](../../reference/cli-commands.md#agent-command-options)
or [environment variables](../../reference/environment-variables.md#agent-command-variables).
The parameters are all set on the `fault agent` command.
If you are not relying on the default setup which uses the OpenAI client, we
suggest that you set the environment variables once and for all. Otherwise,
your command line will get busy very quickly.
## Gemini
fault supports
[Gemini](https://ai.google.dev/).
- [X] Set an Gemini's API key
Set the `GEMINI_API_KEY` for the `fault` binary to pick it up.
```bash
export GEMINI_API_KEY=...
```
Make sure the key is allowed to use the models you wich to use as well.
- [X] Configure the client
Enable the Gemini client. This can also be
set via the `FAULT_AGENT_CLIENT` environment variable.
```bash
--llm-client gemini
```
- [X] Configure the model parameters
The model used for reasoning. This can also be
set via the `LLM_PROMPT_REASONING_MODEL` environment variable.
```bash
--llm-prompt-reasoning-model gemini-2.5-flash
```
The embedding model, default to `text-embedding-3-small`. This can also be
set via the `FAULT_AGENT_EMBED_MODEL` environment variable.
```bash
--llm-embed-model gemini-embedding-exp-03-07
```
!!! warning "Embedding model not yet supported"
Currently, the embedding model is ignored and
fault uses
[fastembed](https://github.com/qdrant/fastembed) instead. A future
release will support Google's model.
The embedding model dimension, default to `384`. This can also be
set via the `FAULT_AGENT_EMBED_MODEL_DIMENSION` environment variable.
```bash
--llm-embed-model-dim 384
```
## OpenAI
fault supports
[OpenAI](https://platform.openai.com/docs/models) and is configured by
default to use it. So you, if you intend on using OpenAI, you only need to set
the `OPENAI_API_KEY` environment variable.
- [X] Set an OpenAI's API key
Set the `OPENAI_API_KEY` for the `fault` binary to pick it up.
```bash
export OPENAI_API_KEY=sk-...
```
Make sure the key is allowed to use the models you wich to use as well.
- [X] Configure the client
Enable the OpenAI client (which is the default). This can also be
set via the `FAULT_AGENT_CLIENT` environment variable.
```bash
--llm-client open-ai
```
- [X] Configure the model parameters
The model used for reasoning, default to `o4-mini`). This can also be
set via the `LLM_PROMPT_REASONING_MODEL` environment variable.
```bash
--llm-prompt-reasoning-model o4-mini
```
The embedding model, default to `text-embedding-3-small`. This can also be
set via the `FAULT_AGENT_EMBED_MODEL` environment variable.
```bash
--llm-embed-model text-embedding-3-small
```
The embedding model dimension, default to `1536`. This can also be
set via the `FAULT_AGENT_EMBED_MODEL_DIMENSION` environment variable.
```bash
--llm-embed-model-dim 1536
```
## Ollama
fault supports
[ollama](https://ollama.com/). This is great if you need to keep data
privacy under control and/or if you have a specific home made model.
- [X] Configure the client
Enable the OpenAI client (which is the default). This can also be
set via the `FAULT_AGENT_CLIENT` environment variable.
```bash
--llm-client ollama
```
- [X] Configure the model parameters
You may specify which [model](https://ollama.com/search)
you want to use via the following parameters:
The model used for reasoning. This can also be
set via the `LLM_PROMPT_REASONING_MODEL` environment variable.
```bash
--llm-prompt-reasoning-model gemma3:4b
```
The embedding model. This can also be
set via the `FAULT_AGENT_EMBED_MODEL` environment variable.
```bash
--llm-embed-model mxbai-embed-large
```
The embedding model dimension. This can also be
set via the `FAULT_AGENT_EMBED_MODEL_DIMENSION` environment variable.
```bash
--llm-embed-model-dim 1024
```
## OpenRouter
fault supports
[OpenRouter](https://openrouter.ai/). This is great if you want to try
many models and find the most appropriate for your needs.
- [X] Set an OpenRouter's API key
Set the `OPENROUTER_API_KEY` for the `fault` binary to pick it up.
```bash
export OPENROUTER_API_KEY=sk-...
```
- [X] Configure the client
Enable the OpenRouter client. This can also be
set via the `FAULT_AGENT_CLIENT` environment variable.
```bash
--llm-client open-router
```
- [X] Configure the model parameters
You may specify which [model](https://openrouter.ai/models)
you want to use via the following parameters:
The model used for reasoning. This can also be
set via the `LLM_PROMPT_REASONING_MODEL` environment variable.
```bash
--llm-prompt-reasoning-model google/gemma-3-27b-it
```
The embedding model dimension. This can also be
set via the `FAULT_AGENT_EMBED_MODEL_DIMENSION` environment variable.
```bash
--llm-embed-model-dim 384
```
!!! warning "No explicit embedding model"
OpenRouter doesn't have embedding models and thus the
`--llm-embed-model` parameter is ignored. However, we set the
the `--llm-embed-model-dim` parameter because we use
[FastEmbed](https://github.com/qdrant/fastembed)
to workaround this issue.
# Configure Your fault MCP Agent Server
This guide will take you through configuring the fault
[MCP server](https://modelcontextprotocol.io/specification/2025-06-18/server).
!!! abstract "Prerequisites"
- [X] Install fault
If you haven’t installed fault yet, follow the
[installation instructions](../install.md).
Make sure the `fault` binary can be found in your `PATH`.
!!! tip
fault respects the [MCP Server](https://modelcontextprotocol.io/specification/2025-06-18/server)
interface. Currently it relies on the [stdio transport](https://modelcontextprotocol.io/specification/2025-06-18/basic/transports#stdio). It should be supported by any MCP
client aware clients.
## Cursor
- [X] Configure the MCP settings for [Cursor](https://www.cursor.com/)
Add the following section to your global {==~/.cursor/mcp.json==} file:
```json
{
"mcpServers": {
"fault": {
"type": "stdio",
"command": "fault",
"disabled": false,
"args": [
"agent",
"tool"
],
"env": {
"OPENAI_API_KEY": "..."
}
}
}
}
```
!!! tip
We are using the default OpenAI API and therefore expect the
`OPENAI_API_KEY`. If you switch to ollama or Open Router, these
settings may differ. Do not commit this file if you copy your key.
You may also want to enable a log file for the `fault` MCP server:
```json
{
"mcpServers": {
"fault": {
"type": "stdio",
"command": "fault",
"disabled": false,
"args": [
"--log-file",
"/tmp/fault.log",
"--log-level",
"debug",
"agent",
"tool"
],
"env": {
"OPENAI_API_KEY": "..."
}
}
}
}
```
You may want to explore the [Cursor](https://docs.cursor.com/context/model-context-protocol) documentation for more
information.
If you want to use ollama instead, for instance using the
[gemma3](https://ollama.com/library/gemma3) model, you may do it as follows:
```json
{
"mcpServers": {
"fault": {
"type": "stdio",
"command": "fault",
"disabled": false,
"args": [
"--log-file",
"/tmp/fault.log",
"--log-level",
"debug",
"agent",
"--llm-client",
"ollama",
"--llm-prompt-reasoning-model",
"gemma3:4b",
"--llm-prompt-chat-model",
"gemma3:4b",
"--llm-embed-model",
"mxbai-embed-large",
"tool"
]
}
}
}
```
## Kilo Code
- [X] Configure the MCP settings for [Kilo Code](https://kilocode.ai/)
Add the following section to the {==.kilocode/mcp.json==} file at the
root directory of any project:
```json
{
"mcpServers": {
"fault": {
"type": "stdio",
"command": "fault",
"disabled": false,
"args": [
"agent",
"tool"
],
"env": {
"OPENAI_API_KEY": "..."
}
}
}
}
```
!!! note
You may need to restart the Visual Studio Code instance for the changes
to take effect.
!!! tip
We are using the default OpenAI API and therefore expect the
`OPENAI_API_KEY`. If you switch to ollama or Open Router, these
settings may differ. Do not commit this file if you copy your key.
You may also want to enable a log file for the `fault` MCP server:
```json
{
"mcpServers": {
"fault": {
"type": "stdio",
"command": "fault",
"disabled": false,
"args": [
"--log-file",
"/tmp/fault.log",
"--log-level",
"debug",
"agent",
"tool"
],
"env": {
"OPENAI_API_KEY": "..."
}
}
}
}
```
You may want to explore the [Kilo Code](https://kilocode.ai/docs/features/mcp/using-mcp-in-kilo-code#configuring-mcp-servers) documentation for more
information.
If you want to use ollama instead, for instance using the
[gemma3](https://ollama.com/library/gemma3) model, you may do it as follows:
```json
{
"mcpServers": {
"fault": {
"type": "stdio",
"command": "fault",
"disabled": false,
"args": [
"--log-file",
"/tmp/fault.log",
"--log-level",
"debug",
"agent",
"--llm-client",
"ollama",
"--llm-prompt-reasoning-model",
"gemma3:4b",
"--llm-prompt-chat-model",
"gemma3:4b",
"--llm-embed-model",
"mxbai-embed-large",
"tool"
]
}
}
}
```
## Kwaak
- [X] Configure the MCP settings for [Kwaak](https://github.com/bosun-ai/kwaak)
Add the following section to the {==kwaak.toml==} file at the
root directory of any project:
```toml
[[mcp]]
name = "fault"
command = "fault"
args = ["--log-file", "/tmp/fault.log", "--log-level", "debug", "agent", "tool"]
env = [["OPENAI_API_KEY", "env:OPENAI_API_KEY"]]
```
!!! tip
We are using the default OpenAI API and therefore expect the
`OPENAI_API_KEY`. If you switch to ollama or Open Router, these
settings may differ. Do not commit this file if you copy your key.
## Zed
- [X] Configure the MCP settings for [Zed](https://zed.dev/)
Add the following section to your project {==~/.zed/settings.json==} settings file:
```json
{
"context_servers": {
"fault": {
"source": "custom",
"command": {
"path": "fault",
"args": ["agent", "tool"],
"env": {
"OPENAI_API_KEY": "..."
}
},
"settings": {}
}
}
}
```
!!! tip
We are using the default OpenAI API and therefore expect the
`OPENAI_API_KEY`. If you switch to ollama or Open Router, these
settings may differ. Do not commit this file if you copy your key.
You may also want to enable a log file for the `fault` MCP server:
```json
{
"context_servers": {
"fault": {
"source": "custom",
"command": {
"path": "fault",
"args": [
"--log-file",
"/tmp/fault.log",
"--log-level",
"debug",
"agent",
"tool"
],
"env": {
"OPENAI_API_KEY": "..."
}
},
"settings": {}
}
}
}
```
You may want to explore the [Zed](https://zed.dev/docs/ai/mcp) documentation for more
information.
## FastMCP
- [X] Configure the MCP settings for [FastMCP](https://github.com/jlowin/fastmcp)
Add the following section to the configuration section:
```python
import os
import shutil
from fastmcp import Client
async list_fault_tools() -> None:
config = {
"mcpServers": {
"local": {
"command": shutil.which("fault"),
"args": [
"--log-file",
"/tmp/fault.log",
"--log-level",
"debug",
"agent",
"tool"
],
"env": {
"OPENAI_API_KEY": os.getenv("OPENAI_API_KEY")
}
},
}
}
async with Client(config) as client:
fault_tools = await client.list_tools()
```
## Next Steps
You've successfully deployed fault MCP server in your
favourite AI code editor.
- **Explore our [MCP tools](./mcp-tools.md)** to learn how to first use the agent.
# Explore fault MCP Agent Tools
This guide will take you through the
[MCP tools](https://modelcontextprotocol.io/introduction) supported by
fault agent.
!!! abstract "Prerequisites"
- [X] Install fault
If you haven’t installed fault yet, follow the
[installation instructions](../install.md).
- [X] Get an OpenAI Key
For the purpose of the guide, we will be using OpenAI models. You
need to create an API key. Then make sure the key is available for
fault:
```bash
export OPENAI_API_KEY=sk-...
```
The agent works fine with [Gemini](https://ai.google.dev/),
[ollama](./llm-configuration.md#ollama) and
[OpenRouter](./llm-configuration.md#openrouter) so you may switch to
either. You want to have a look at an [example below](#tool-full-file-code-changes-recommendations).
- [X] Install a local qdrant database
fault uses [qdrant](https://qdrant.tech/) for its vector database. You
can install a [local](https://qdrant.tech/documentation/quickstart/),
free, qdrant using docker:
```bash
docker run -p 6333:6333 -p 6334:6334 -v "$(pwd)/qdrant_storage:/qdrant/storage:z" qdrant/qdrant
```
While not used by every tools, we suggest you start one up to explore
all of them.
- [X] Install the Python FastMCP library
fault does not need this library to work but
to demonstrate the tools we support, we will be using
[FastMCP](https://github.com/jlowin/fastmcp).
!!! example "fault with Cursor"
Below is an example of using fault AI tools in
[Cursor](https://www.cursor.com/) to help it make the generated code more
production ready.
\<1% errors|501.11 ms
6.5% errors (4/62)|+201.11 ms
+5.5 pp|outage-induced tail & error spike| |Periodic 150–250 ms latency pulses during load|`POST /users/`|p95 latency|p95 \< 300 ms|672.51 ms|+372.51 ms|repeated latency bursts| |5% packet loss for 4 s|`POST /users/`|response latency|\< 100 ms|185.92 ms|+85.92 ms|single drop → retry/backoff overhead| |Full black-hole for 1 s|`POST /users/`|p95 latency, error rate|p95 \< 300 ms
\<1% errors|501.97 ms
16.1% errors (10/62)|+201.97 ms
+15.1 pp|outage-triggered failures & tail latency| |Single high-latency spike (800 ms)|`GET /users/{user_id}`|200 OK rate|100% 200 OK|0% success (1/1 failure)|1 failure|single outlier rejection| |Stair-step latency growth (5×100 ms)|`GET /users/{user_id}`|200 OK rate|100% 200 OK|0% success (6/6 failures)|6 failures|progressive head-of-line blocking| |5% packet loss for 4 s|`GET /users/{user_id}`|200 OK rate|100% 200 OK|0% success (1/1 failure)|1 failure|single packet loss → error| |High jitter (±80 ms @ 8 Hz)|`GET /users/{user_id}`|200 OK rate|100% 200 OK|0% success (1/1 failure)|1 failure|jitter spike causing drop| |Periodic 150–250 ms latency pulses during load|`GET /users/{user_id}`|p95 latency|p95 \< 300 ms|602.81 ms|+302.81 ms|consistent tail uplift across bursts| |Full black-hole for 1 s|`GET /users/{user_id}`|p95 latency, error rate|p95 \< 300 ms
\<1% errors|500.84 ms
6.5% errors (4/62)|+200.84 ms
+5.5 pp|drop-window failure surge| **Dashboard Summary** |Scope|Total Scenarios|Passed|Failed| |-----|---------------|------|------| |All endpoints|24|14|10| |• `GET /`|8|6|2| |• `POST /users/`|8|5|3| |• `GET /users/{user_id}`|8|3|5| ## Potential Root-Cause Hypotheses *Based on the observed latency spikes, error surges, and retry overhead, here are the most plausible developer-actionable causes* 1. Missing client-side retries and back-off for transient network glitches *Symptom mapping:* * Single-request failures on 5% packet-loss and jitter tests * One-off 200 OK rejections instead of recovery *Hypothesis:* The HTTP client in the service has no retry or exponential back-off logic for transient TCP/IP errors or dropped packets. As soon as a packet is lost or a jitter spike occurs, requests fail immediately (HTTP 5xx or connection errors), violating the 100 % success SLO. *Actionable next steps:* * Implement idempotent request retries with back-off for GET and POST handlers * Add circuit-breaker thresholds to prevent avalanche retries under sustained network issues 1. No per-request timeout leading to head-of-line blocking *Symptom mapping:* * Stair-step latency growth (5×100 ms increments) * Periodic 150–250 ms tail-latency pulses during load * "Full black-hole" outages causing sustained queue buildup *Hypothesis:* The system lacks explicit request or downstream call timeouts, so slow or black-holed calls pile up in the server’s worker pool. Under load, blocked threads/tasks queue additional requests, amplifying tail latency in a cascading fashion. *Actionable next steps:* * Configure per-call timeouts on HTTP client and database calls * Enforce max-duration policies at the gateway or service middleware 1. Thread/connection pool exhaustion under bursty load *Symptom mapping:* * Sustained tail uplift across load bursts * Outage-induced error spikes when pools saturate * Progressive latency amplification under write/read contention *Hypothesis:* The service uses a fixed-size thread or connection pool (e.g., database or HTTP connection pool) that maxes out during periodic write bursts or network black-holes. Once the pool is exhausted, new requests block or fail until capacity frees up. *Actionable next steps:* * Increase pool sizes or switch to non-blocking async I/O * Introduce load-shedding or queues to smooth bursty traffic profiles ## Recommendations *Actionable changes to address the three root‐cause hypotheses* Below are four prioritized recommendation sets. Each set includes specific code/config changes (shown in PR‐style diffs), their priority classification, and a summary table to help you weigh cost, complexity, and benefits. --- ### 1. Add Idempotent Retries with Exponential Back-off *Priority: Recommended* Rationale: Smooth out transient network errors (packet loss, jitter) by automatically retrying idempotent calls. #### Proposed Changes ````diff --- a/app/client.py +++ b/app/client.py @@ -import httpx +import httpx +from tenacity import ( + retry, + wait_exponential, + stop_after_attempt, + retry_if_exception_type, +) + +# Wrap idempotent HTTP calls in a retry policy @retry( - retry=retry_if_exception_type(SomeError), - wait=wait_fixed(1), - stop=stop_after_attempt(3), + retry=retry_if_exception_type(httpx.TransportError), + wait=wait_exponential(multiplier=0.2, max=2), + stop=stop_after_attempt(4), reraise=True, ) async def fetch_user_profile(user_id: str) -> dict: """GET /users/{id} with retry/back-off on transport failures.""" - response = httpx.get(f"https://api.example.com/users/{user_id}") + response = httpx.get( + f"https://api.example.com/users/{user_id}", + timeout=5.0, + ) response.raise_for_status() return response.json() ```` Discussion: * Adds `tenacity` to retry on `TransportError` up to 4 times. * Implements exponential back-off (0.2s→0.4s→0.8s…). * Sets a per-request `timeout` so retries kick in quickly. --- ### 2. Enforce Per‐Request Timeouts to Prevent Head-of-Line Blocking *Priority: Critical* Rationale: Bound each upstream call to release workers quickly, avoiding thread/event-loop saturation. #### Proposed Changes ````diff --- a/app/main.py +++ b/app/main.py import asyncio import httpx +from fastapi import HTTPException from app.client import fetch_user_profile @app.get("/profile/{user_id}") async def get_profile(user_id: str): - data = await fetch_user_profile(user_id) - return data + try: + # Bound to 4s so hung calls free up the worker + task = asyncio.create_task(fetch_user_profile(user_id)) + return await asyncio.wait_for(task, timeout=4.0) + except asyncio.TimeoutError: + raise HTTPException(status_code=504, detail="Upstream request timed out") ```` Discussion: * Uses `asyncio.wait_for` to impose a hard 4s timeout. * Converts timeouts into 504 responses, avoiding pile-ups. --- ### 3. Scale Pools & Introduce Circuit-Breakers for Bursty Load *Priority: Recommended* Rationale: Prevent connection/thread pool exhaustion and break cascading failures under sustained error bursts. #### Proposed Changes ````diff --- a/app/db_config.py +++ b/app/db_config.py from sqlalchemy import create_engine -from sqlalchemy.pool import NullPool +from sqlalchemy.pool import QueuePool engine = create_engine( DATABASE_URL, - poolclass=NullPool, + poolclass=QueuePool, + pool_size=20, # baseline open connections + max_overflow=30, # allow bursts up to 50 total + pool_timeout=5, # wait up to 5s for a free connection ) ```` ````diff --- a/app/client.py +++ b/app/client.py -import httpx +import httpx +from pybreaker import CircuitBreaker # Add a circuit-breaker to fail fast when upstream degrades http_breaker = CircuitBreaker(fail_max=5, reset_timeout=30) -@retry(...) +@http_breaker async def fetch_user_profile(...): ... ```` Discussion: * Configures `QueuePool` to handle bursts (20 steady + 30 overflow). * `pool_timeout=5s` causes rapid fallback if the DB is saturated. * Circuit-breaker rejects calls after 5 consecutive failures, preventing retry storms. --- ### 4. Infrastructure & Traffic Patterns (Cross-cutting) *Priority: Nice-to-have* * Enable autoscaling based on latency or error‐rate SLOs. * Tune load-balancer idle‐timeouts just above service-level timeouts. * Introduce ingress rate limiting (token-bucket) to shed excess traffic during spikes. * Deploy multi-AZ replicas with health checks for failover resilience. --- ## Summary & Prioritization |Recommendation|Priority|Complexity|Cost|Expected Benefit| |--------------|--------|----------|----|----------------| |1. Retry with exponential back-off (tenacity)|Recommended|Low|Low|Fewer transient errors, higher success rate| |2. Per-request timeouts (`asyncio.wait_for`)|Critical|Medium|Low|Prevents H-of-L blocking, protects worker pool| |3. Tune pools & add circuit-breakers|Recommended|Medium|Medium|Smooths bursts, stops failure cascades| |4. Infra: autoscaling, LB configs, rate limiting|Nice-to-have|Medium|Medium|Improves global resiliency and traffic shaping| ## Threats & Next Steps *Analysis of potential trade-offs, failure modes, monitoring and downstream impacts* |Recommendation|Risk / Trade-off|How It Materializes|Monitoring & Validation|Downstream Impact| |--------------|----------------|-------------------|-----------------------|-----------------| |1. Retry with exponential back-off|• Masks genuine faults
• Spike in request volume|• Upstream returns 500 consistently → burst of retries overwhelms network|• Track `retry_count` vs. success rate
• Alert if retries > 5% of total calls|• Increased latency, higher bandwidth bills, SLA drift| |2. Per-request timeouts (`asyncio.wait_for`)|• Valid slow calls get 504s
• Orphaned tasks consume memory|• Cold-start or GC pause → legitimate call aborted
• Canceled tasks never cleaned up|• Monitor `504_rate`, p99 latency
• Measure orphaned task count via APM|• User-facing errors, degraded UX, support tickets rise| |3. Scale pools & circuit-breakers|• Misconfigured pool can throttle legit traffic
• Circuit stays open too long|• Sudden burst → pool timeout→ immediate rejects
• CircuitBreaker trips on transient glitch and blocks recovery|• Alert on `pool_timeout` errors
• Track breaker state transitions and recovery time|• Transaction failures, order loss, downstream retries| |4. Autoscaling & rate limiting|• Over-scaling increases cost
• Aggressive throttling drops good traffic|• Rapid traffic spike → scaling lag → latency spike
• Rate limiter rejects peak requests, partners hit errors|• Log `scale_up/scale_down` latency
• Monitor `throttle_rate` vs. error rate|• SLA violations, partner complaints, revenue impact| To validate and prevent regressions: * Introduce chaos tests in staging (simulate network errors, high latency). * Define SLOs and dashboards for each metric. * Set automated alerts when thresholds breach. --- Generated on 2025-05-12 14:36:01.659176703 UTC !!! important It's interesting to notice that the report shows some possible code changes. fault isn't aware of your code (it will be once you call the [code-review](./code-suggestions.md) command) so it illustrates its advices with placeholder code snippets. Let's now assume you have run the [code-review](./code-suggestions.md) command, you may re-run the {==scenario-review==} command which will pick up on the indexed code. ??? example "Generated review report once the source code has been indexed" # fault resilience report analysis ## Table of Contents - [Overall Resilience Posture](#overall-resilience-posture) - [SLO Failures Deep Dive](#slo-failures-deep-dive) - [Potential Root-Cause Hypotheses](#potential-root-cause-hypotheses) - [Recommendations](#recommendations) - [1. Mitigate SQLite Lock Contention](#1-mitigate-sqlite-lock-contention) - [2. Enforce Timeouts on Blocking DB Operations](#2-enforce-timeouts-on-blocking-db-operations) - [3. Add Retry/Back-off for Transient Failures](#3-add-retryback-off-for-transient-failures) - [4. Infrastructure & Operational Patterns](#4-infrastructure--operational-patterns) - [Summary & Prioritization Table](#summary--prioritization-table) - [Threats & Next Steps](#threats--next-steps) - [Detailed Threats & Next Steps](#detailed-threats--next-steps) --- ## Executive Summary **Findings** * Our SQLite configuration uses default durability and a single‐threaded pool, constraining throughput and exposing us to lock contention under concurrent writes. * There is no structured timeout or retry logic around database calls, so transient errors or slow queries can stall requests or cascade failures. **Recommendations** 1. Enable WAL mode with `synchronous=NORMAL` and switch to a singleton thread pool 1. Enforce per-call timeouts with `asyncio.wait_for` 1. Add exponential-backoff retries using `tenacity` 1. Introduce infrastructure patterns: load-balancing, rate-limiting, and circuit breakers **Key Trade-offs & Threats** * Durability vs. Performance * `synchronous=NORMAL` improves write throughput but risks losing sub-millisecond commits on crash. * Premature Aborts * Fixed timeouts may cancel valid, long-running queries and risk thread-pool leaks. * Hidden Faults * Retries can mask schema drift or resource exhaustion, delaying root-cause fixes. * Operational Complexity * Misconfigured circuit breakers or rate limits can lead to unintended service disruption. **Next Steps & Validation** * Fault Injection * Terminate the process during commit to verify acceptable data-loss window. * Load & Chaos Testing * Simulate 100+ concurrent writers to benchmark p50/p99 latency. * Inject `SQLAlchemyError` in staging to validate retry back-off behavior. * Monitoring & Alerts * Track WAL checkpoint lag, file size, and disk usage. * Alert on SQLite `timeout` errors and 504 responses. * Expose metrics for retry counts, back-off durations, thread-pool utilization, and circuit-breaker transitions. ## Overall Resilience Posture The root (`/`) endpoint proved highly resilient - handling latency spikes, jitter, packet loss, bandwidth caps and injected HTTP errors with zero expectation failures and meeting all latency SLOs. The `POST /users/` endpoint generally stayed functional but breached P95 latency objectives during periodic latency pulses and full black-hole faults, while the `GET /users/{user_id}` endpoint suffered status-code failures and missed P95/P99 SLOs under high-latency, packet-loss and jitter scenarios, indicating its timeout and retry logic needs strengthening. ## SLO Failures Deep Dive *Detailed breakdown of every scenario where one or more SLOs were breached, including the objective, the observed violation, and the characteristic failure pattern.* |Scenario|Endpoint|SLO Violated|Objective|Observed|Margin|Failure Pattern| |--------|--------|------------|---------|--------|------|---------------| |Periodic 150–250 ms pulses during load|GET `/`|P95 latency|95% \< 300 ms|593.80 ms|+293.80 ms|Tail-latency uplift during each burst| |Full black-hole for 1 s|GET `/`|P95 latency|95% \< 300 ms|501.11 ms|+201.11 ms|Outage window spikes p95| |Full black-hole for 1 s|GET `/`|Error rate|\< 1% errors|6.5%|+5.5 pp|Concentrated packet loss causing errors| |Periodic 150–250 ms pulses during load|POST `/users/`|P95 latency|95% \< 300 ms|641.46 ms|+341.46 ms|Sustained tail-latency drift across bursts| |Random 500 errors (5% of calls)|POST `/users/`|P95 latency|95% \< 300 ms|527.19 ms|+227.19 ms|Retry/back-off overhead inflates tail latencies| |Full black-hole for 1 s|POST `/users/`|P95 latency|95% \< 300 ms|501.15 ms|+201.15 ms|Outage-induced latency spikes| |Full black-hole for 1 s|POST `/users/`|Error rate|\< 1% errors|12.9%|+11.9 pp|Black-hole period yields concentrated failures| |Single high-latency spike|GET `/users/{user_id}`|Availability|100% 200 OK|0% success|−1 request|One request timed out under an 800 ms ingress spike| |Stair-step latency growth (5×100 ms)|GET `/users/{user_id}`|Availability|100% 200 OK|0% success|−6 requests|Progressive delays triggered all timeouts| |Periodic 150–250 ms pulses during load|GET `/users/{user_id}`|P95 latency|95% \< 300 ms|608.27 ms|+308.27 ms|Tail-latency uplift sustained through bursts| |5% packet loss for 4 s|GET `/users/{user_id}`|Availability|100% success|0% success|−1 request|Single packet drop caused one unmet expectation| |High jitter (±80 ms @ 8 Hz)|GET `/users/{user_id}`|Availability|100% 200 OK|0% success|−1 request|Bursty jitter produced one unexpected failure| |Full black-hole for 1 s|GET `/users/{user_id}`|P95 latency|95% \< 300 ms|500.70 ms|+200.70 ms|Outage window causes p95 spike| |Full black-hole for 1 s|GET `/users/{user_id}`|Error rate|\< 1% errors|6.5%|+5.5 pp|Packet loss concentrated into errors| **Dashboard Summary** |Scope|Total Scenarios|Passed|Failed| |-----|---------------|------|------| |All endpoints|29|18|11| |• GET `/`|8|6|2| |• POST `/users/`|8|5|3| |• GET `/users/{user_id}`|13|7|6| ## Potential Root-Cause Hypotheses *Based on the observed SLO-failure patterns, here are the most plausible developer-actionable causes* 1. SQLite file‐locking contention under bursty writes *Symptom mapping:* periodic tail‐latency pulses on POST `/users/`, stair-step latency growth, "full black-hole" latency spikes during write bursts *Hypothesis:* the app uses file-based SQLite with default settings. Concurrent commits serialize on the SQLite file lock, so under load writes queue up, inflating p95/p99 latencies and even timing out when the lock persists. 1. Blocking synchronous DB calls in `async` endpoints *Symptom mapping:* erratic high-latency spikes, sustained tail-latency uplift across GET and POST endpoints, progressive latency amplification *Hypothesis:* synchronous SQLAlchemy calls (`db.commit()`, `db.refresh()`) inside `async def` handlers run on FastAPI’s default threadpool without per-call timeouts. Under bursty traffic, threads saturate, event-loop tasks pile up, and tail latencies spiral out of control. 1. Missing retry/back-off logic for transient failures *Symptom mapping:* isolated 500 errors on 5% packet-loss and jitter scenarios, error-rate spikes when brief network hiccups occur *Hypothesis:* the code doesn’t wrap transient SQLAlchemy or I/O exceptions in retry/back-off. A single dropped packet or momentary DB hiccup surfaces immediately as an HTTP 500, breaching the \<1% error‐rate and 100% availability SLOs. ## Recommendations *Actionable changes to address SQLite contention, sync-call blocking, and transient error handling* Below are four recommendation sets, each with PR-style diffs, priority labels, and a summary table to help weigh cost, complexity, and impact. --- ### 1. Mitigate SQLite Lock Contention **Priority:** Recommended **Rationale:** Under concurrent writes, the default SQLite engine serializes on a file lock; this causes p99 latency spikes. Enabling WAL mode, tuning timeouts, and serializing access reduces contention. #### Proposed Changes ````diff --- a/app.py +++ b/app.py @@ Database configuration -engine = create_engine("sqlite:///./test.db") +from sqlalchemy.pool import SingletonThreadPool +engine = create_engine( + "sqlite:///./test.db", + connect_args={ + # wait up to 10s to acquire file lock before failing + "timeout": 10, + # allow SQLite connections across threads + "check_same_thread": False, + }, + # serialize all connections to reduce lock thrashing + poolclass=SingletonThreadPool, +) SessionLocal = sessionmaker(autocommit=False, autoflush=False, bind=engine) @@ Base.metadata.create_all(bind=engine) + +# Enable WAL and tune synchronous mode on each new connection +from sqlalchemy import event +@event.listens_for(engine, "connect") +def _enable_sqlite_wal(dbapi_conn, conn_record): + cursor = dbapi_conn.cursor() + cursor.execute("PRAGMA journal_mode=WAL;") + cursor.execute("PRAGMA synchronous=NORMAL;") + cursor.close() ```` **Discussion:** * Sets a 10 s `timeout` so writers block rather than immediately error. * Switches to `SingletonThreadPool` to serialize commits. * Enables WAL for concurrent readers and faster writes. --- ### 2. Enforce Timeouts on Blocking DB Operations **Priority:** Critical **Rationale:** Synchronous `db.commit()` inside `async def` handlers consumes threadpool workers indefinitely under bursts, amplifying tail latencies. Bounding each call prevents thread-starvation. #### Proposed Changes ````diff --- a/app.py +++ b/app.py import asyncio from functools import partial @@ @app.post("/users/") async def create_user( name: Annotated[str, Body()], password: Annotated[str, Body()], db: sessionmaker[Session] = Depends(get_db), ): - db_user = User(name=name, password=password) - db.add(db_user) - db.commit() - db.refresh(db_user) - return db_user + # run blocking DB ops on threadpool with a 5s timeout + def _sync_create(): + u = User(name=name, password=password) + db.add(u) + db.commit() + db.refresh(u) + return u + try: + task = asyncio.get_event_loop().run_in_executor(None, _sync_create) + return await asyncio.wait_for(task, timeout=5.0) + except asyncio.TimeoutError: + raise HTTPException(status_code=504, detail="Database operation timed out") + except SQLAlchemyError: + db.rollback() + raise HTTPException(status_code=500, detail="DB error") ```` **Discussion:** * Uses `run_in_executor` + `wait_for(5s)` to bound each DB call. * Converts `TimeoutError` to 504, protecting the event loop and threadpool. --- ### 3. Add Retry/Back-off for Transient Failures **Priority:** Recommended **Rationale:** Single SQLAlchemy errors (lock conflicts, I/O glitches) should retry instead of returning 500 immediately. #### Proposed Changes ````diff --- a/app.py +++ b/app.py from sqlalchemy.exc import SQLAlchemyError +from tenacity import retry, stop_after_attempt, wait_exponential, retry_if_exception_type @app.post("/users/") async def create_user(...): - # existing commit logic + # wrap in retry for transient DB errors + @retry( + retry=retry_if_exception_type(SQLAlchemyError), + wait=wait_exponential(multiplier=0.5, max=2), + stop=stop_after_attempt(3), + reraise=True, + ) + def _insert(): + u = User(name=name, password=password) + db.add(u) + db.commit() + db.refresh(u) + return u + + try: + return _insert() + except SQLAlchemyError: + db.rollback() + raise HTTPException(status_code=500, detail="Database error") ```` **Discussion:** * Retries up to 3 times with exponential back-off (0.5s→1s→2s). * Prevents transient lock or I/O errors from bubbling up immediately. --- ### 4. Infrastructure & Operational Patterns **Priority:** Nice-to-have **Recommendations:** * Deploy behind a load balancer with health checks and connection draining. * Add rate limiting (e.g. via API gateway) to smooth request bursts. * Plan horizontal scaling: containerize service, mount an external RDBMS for true *scale-out*. * Implement metrics and circuit breakers (e.g. via Prometheus + a service mesh) for early fault isolation. --- ## Summary & Prioritization Table |Recommendation|Priority|Complexity|Cost|Expected Benefit| |--------------|--------|----------|----|----------------| |1. Enable WAL, timeout & SingletonThreadPool|Recommended|Low|Low|Reduces SQLite lock waits, fewer p99 spikes| |2. Enforce per-call timeout (`asyncio.wait_for`)|Critical|Medium|Medium|Prevents threadpool exhaustion and tail latency| |3. Add retry/back-off via `tenacity`|Recommended|Medium|Low|Fewer transient 500s, higher success rate| |4. Infra patterns: LB, rate-limits, scaling|Nice-to-have|Medium|Medium|Smoother burst handling, improved resilience| ## Threats & Next Steps *Analysis of potential risks/trade-offs and validation steps for each recommendation* Below is a concise summary of the main risks for each recommendation, how they could materialize in production, and the key metrics or tests to monitor for regressions or downstream impact. |Recommendation|Potential Risk / Trade-off|How It Can Materialize|Monitoring & Validation| |--------------|--------------------------|----------------------|-----------------------| |1. Enable WAL, `timeout`, `SingletonThreadPool`|• Reduced crash durability (synchronous=NORMAL)
• Longer queue times under heavy writes|• Power loss may drop last-millisecond writes
• p99 write latency spikes|• Track WAL checkpoint lag and file size
• Alert on SQLite `timeout` errors
• Measure write p50/p99 under synthetic 50–200 concurrent writers| |2. Enforce per-call timeout (`asyncio.wait_for`)|• Legitimate slow ops become 504s
• Orphaned threads if tasks aren’t cancelled cleanly|• Bulk imports or cold caches hit 5 s boundary
• Threadpool exhaustion|• Monitor 504 Gateway Timeout rate by endpoint
• Track threadpool utilization and queue length
• Load-test slow queries to tune timeout threshold| |3. Add retry/back-off via `tenacity`|• Conceals systemic faults (schema drift, disk full)
• Excess retries amplify load during outages|• Persistent errors trigger back-off loops, delaying failure escalation|• Expose metrics: retry count, back-off duration, final failures
• Alert when retries > X% of writes
• Chaos-inject transient errors in staging| |4. Infra & operational patterns (LB, rate-limit, CBs)|• Operational complexity and mis-configuration risk
• Potential cascading failures if circuit breakers are too tight|• Mis-routed traffic or DDoS bypassing rate-limits
• Circuit stays open long|• Verify load-balancer health-check success rates
• Simulate traffic bursts to validate rate-limiting
• Monitor CB open/close events and error rates| --- ### Detailed Threats & Next Steps 1. **Enable WAL, `timeout`, `SingletonThreadPool`** * Threats & Trade-offs * Looser durability: `PRAGMA synchronous=NORMAL` may drop in-flight writes on crash. * Increased latency: writers queue behind the file lock. * Next Steps / Tests * Fault-injection: kill process mid-commit and verify acceptable data loss window. * High-concurrency load: simulate 100+ parallel writers and chart p50/p99 latency. * Monitor WAL size and checkpoint frequency; alert before disk saturation. 1. **Enforce per-call timeout (`asyncio.wait_for`)** * Threats & Trade-offs * Valid, but slow operations get 504s and leak user trust. * Orphaned threads if the sync call doesn’t cancel promptly can exhaust the pool. * Next Steps / Tests * Load-test with slow I/O patterns (large payloads, cold DB cache) to calibrate 5 s threshold. * Track 504 rates by endpoint; set alert when above SLA target (e.g., >1%). * Instrument threadpool metrics (active threads, queue length) and ensure cleanup. 1. **Add retry/back-off via `tenacity`** * Threats & Trade-offs * Masks root causes (schema mismatch, full disk), delaying permanent fix. * Multiple retries under sustained failures amplify resource consumption. * Next Steps / Tests * Emit metrics for each retry attempt and terminal failure; configure alert when retries exceed 5% of writes. * Chaos-inject `SQLAlchemyError` in staging to verify exponential back-off intervals (0.5s→1s→2s). * Review logs for hidden or stuck operations. 1. **Infra & operational patterns (LB, rate-limit, circuit breakers)** * Threats & Trade-offs * Increases operational complexity; mis-config can cause outage or unbalanced traffic. * Over-aggressive circuit breakers can prevent recovery when transient blips occur. * Next Steps / Tests * Validate blue/green or canary deploys to ensure zero-downtime rollouts. * Run controlled traffic spikes to exercise API gateway rate-limits; verify back-pressure behavior. * Monitor CB state transitions, error budgets, and downstream SLA impact. By implementing these monitoring strategies and targeted failure tests in staging and production, you can validate that each mitigation improves resilience without introducing unacceptable business risk. --- Generated on 2025-05-12 16:51:44.346989509 UTC - [X] Generate a PDF version of the report fault only generates a markdown format. You may convert it to a PDF document using [pandoc](https://pandoc.org/). We suggest that you also use the [Eisvogel](https://github.com/Wandmalfarbe/pandoc-latex-template) template for a sleek rendering. Once installed, you may run a command such as: ```bash pandoc scenario-analysis-report.md -o scenario-analysis-report.pdf \ --listings --pdf-engine=xelatex \ --template eisvogel # (1)! ``` 1. If you didn't installed the Eisvogel template, just remove this flag ## Next Steps - **Learn how [review](./code-suggestions.md)** your code base. # Execute Scenarios From GitHub Action This guide will walk you through integrating fault into your GitHub pipeline. ## What You'll Achieve You will learn how to run a fault scenario as part of your GitHub workflow and use the result to fail a GitHub job. !!! example "Start your application first" The guides below do not show how to run the target service from within your workflow. For instance, you could run a step like this first: ```yaml - name: Run application under test in the background shell: bash run: RUNNER_TRACKING_ID="" && (nohup ./my-app &) ``` ## Run fault's scenario The basic approach to run fault scenarios in your GitHub workflows is to use the dedicated [action](https://github.com/rebound-how/actions). - [X] Run fault's scenario ```yaml title=".github/workflows/reliability.yaml" name: Run fault scenarios on: workflow_dispatch: jobs: run-reliability-scenarios: runs-on: ubuntu-latest steps: - uses: actions/checkout@v4 - uses: rebound-how/actions/fault@main # (1)! with: scenario: scenario.yaml # (2)! ``` 1. Add the fault [action](https://github.com/rebound-how/actions) 2. Path to a [scenario file](../../tutorials/create-scenario.md) or a directory containing scenario files ## Create an issue when at least one test failed - [X] Run fault's scenario ```yaml title=".github/workflows/reliability.yaml" name: Run fault scenarios on: workflow_dispatch: jobs: run-reliability-scenarios: runs-on: ubuntu-latest steps: - uses: actions/checkout@v4 - uses: rebound-how/actions/fault@main # (1)! with: scenario: scenario.yaml # (2)! report: report.md # (3)! create-issue-on-failure: "true" # (4)! github-token: ${{ secrets.GITHUB_TOKEN }} # (5)! ``` 1. Add the fault [action](https://github.com/rebound-how/actions) 2. Path to a [scenario file](../../tutorials/create-scenario.md) or a directory containing scenario files 3. Export the report as a markdown document as it will be used as the body of the issue 4. Tell the action to create the issue if at least one test failed 5. Provide the github token so the operation is authenticaed appropriately. Make sure the token has [write permissions](https://docs.github.com/en/actions/security-for-github-actions/security-guides/automatic-token-authentication#modifying-the-permissions-for-the-github_token) # Fault Injection Into AWS This guide will walk you through injecting network faults into AWS ECS platform. Without changing any application code. ???+ abstract "Prerequisites" - [X] Install fault If you haven’t installed fault yet, follow the [installation instructions](../install.md). ???- question "How about other AWS services?" fault supports ECS natively as well as EKS through the `fault inject kubernetes` command. What about EC2 or Lambda? Both may be featured in the future indeed if they are asked for by the community.
 ## Inject Latency Into a ECS Service
ECS is the AWS platform to run workload using containers. The approach taken
by fault is to add a sidecar container to an existing
ECS task definition. This container then becomes the entrypoint of network
traffic, meaning we switch the the Load Balancer target group to point to the
new container's port. fault is configured to then route
all traffic from that port to the application's port transparently. When done,
we rollback to the previous task definition and load balancer configuration.
**raffic Before fault Is Injected**
```mermaid
---
config:
theme: 'default'
themeVariables:
'git0': '#ff00ff'
gitGraph:
showBranches: true
showCommitLabel: true
mainBranchName: 'normal'
---
gitGraph
commit id: "LB"
commit id: "Target Groups"
commit id: "Target"
commit id: "ECS Service"
commit id: "Application Container"
```
**Traffic After fault Is Injected**
```mermaid
---
config:
theme: 'default'
themeVariables:
'git0': '#ff00ff'
'git1': '#00ffff'
gitGraph:
showBranches: true
showCommitLabel: true
mainBranchName: 'normal'
---
gitGraph
commit id: "LB"
commit id: "Injected" type: HIGHLIGHT
branch fault
commit id: "Target Groups"
commit id: "ECS Service"
commit id: "fault Container"
commit id: "Application Container"
checkout normal
merge fault id: "Rolled back" type: HIGHLIGHT
```
- [X] Create a basic ECS service
You may want to follow the official [AWS documentation](https://docs.aws.amazon.com/AmazonECS/latest/developerguide/create-service-console-v2.html) to create a service.
Make sure to associate the service to a target group attached to a load
balancer.
- [X] Inject fault into the ECS service
The following injects a `800ms` into the service response time.
```bash
fault inject aws \
--region
## Inject Latency Into a ECS Service
ECS is the AWS platform to run workload using containers. The approach taken
by fault is to add a sidecar container to an existing
ECS task definition. This container then becomes the entrypoint of network
traffic, meaning we switch the the Load Balancer target group to point to the
new container's port. fault is configured to then route
all traffic from that port to the application's port transparently. When done,
we rollback to the previous task definition and load balancer configuration.
**raffic Before fault Is Injected**
```mermaid
---
config:
theme: 'default'
themeVariables:
'git0': '#ff00ff'
gitGraph:
showBranches: true
showCommitLabel: true
mainBranchName: 'normal'
---
gitGraph
commit id: "LB"
commit id: "Target Groups"
commit id: "Target"
commit id: "ECS Service"
commit id: "Application Container"
```
**Traffic After fault Is Injected**
```mermaid
---
config:
theme: 'default'
themeVariables:
'git0': '#ff00ff'
'git1': '#00ffff'
gitGraph:
showBranches: true
showCommitLabel: true
mainBranchName: 'normal'
---
gitGraph
commit id: "LB"
commit id: "Injected" type: HIGHLIGHT
branch fault
commit id: "Target Groups"
commit id: "ECS Service"
commit id: "fault Container"
commit id: "Application Container"
checkout normal
merge fault id: "Rolled back" type: HIGHLIGHT
```
- [X] Create a basic ECS service
You may want to follow the official [AWS documentation](https://docs.aws.amazon.com/AmazonECS/latest/developerguide/create-service-console-v2.html) to create a service.
Make sure to associate the service to a target group attached to a load
balancer.
- [X] Inject fault into the ECS service
The following injects a `800ms` into the service response time.
```bash
fault inject aws \
--region  ## Inject Latency Into a Cloud Run Service
Clmoud Run is the GCP platform to run workload using containers. The approach taken
by fault is to create a new revision where we add a
sidecar container to an existing Cloud Run specification. This container then
becomes the entrypoint of network
traffic. fault is configured to then route
all traffic from that port to the application's port transparently. When done,
we rollback to the previous revision.
**raffic Before fault Is Injected**
```mermaid
---
config:
theme: 'default'
themeVariables:
'git0': '#ff00ff'
gitGraph:
showBranches: true
showCommitLabel: true
mainBranchName: 'normal'
---
gitGraph
commit id: "LB"
commit id: "Backend Service"
commit id: "Cloud Run"
commit id: "Application Container"
```
**Traffic After fault Is Injected**
```mermaid
---
config:
theme: 'default'
themeVariables:
'git0': '#ff00ff'
'git1': '#00ffff'
gitGraph:
showBranches: true
showCommitLabel: true
mainBranchName: 'normal'
---
gitGraph
commit id: "LB"
commit id: "Injected" type: HIGHLIGHT
commit id: "Backend Service"
branch fault
commit id: "Cloud Run"
commit id: "fault Container"
commit id: "Application Container"
checkout normal
merge fault id: "Rolled back" type: HIGHLIGHT
```
- [X] Create a basic Cloud Run service
You may want to follow the official [GCP documentation](https://cloud.google.com/run/docs/quickstarts/deploy-container) to deploy a sample service.
- [X] Upload the fault container image to a GCP artifactory
Cloud Run will expect the fault image to be pulled
from an artifactory in the same region (or a global one). So this means,
you must upload the official fault image to your
own artifactory repository.
Follow the [official documentation](https://cloud.google.com/artifact-registry/docs/docker/pushing-and-pulling#pushing) to upload the [fault image](https://github.com/rebound-how/rebound/pkgs/container/fault)
Something along the lines:
```bash
# locally download the official fault image
docker pull ghcr.io/fault-project/fault-cli:
## Inject Latency Into a Cloud Run Service
Clmoud Run is the GCP platform to run workload using containers. The approach taken
by fault is to create a new revision where we add a
sidecar container to an existing Cloud Run specification. This container then
becomes the entrypoint of network
traffic. fault is configured to then route
all traffic from that port to the application's port transparently. When done,
we rollback to the previous revision.
**raffic Before fault Is Injected**
```mermaid
---
config:
theme: 'default'
themeVariables:
'git0': '#ff00ff'
gitGraph:
showBranches: true
showCommitLabel: true
mainBranchName: 'normal'
---
gitGraph
commit id: "LB"
commit id: "Backend Service"
commit id: "Cloud Run"
commit id: "Application Container"
```
**Traffic After fault Is Injected**
```mermaid
---
config:
theme: 'default'
themeVariables:
'git0': '#ff00ff'
'git1': '#00ffff'
gitGraph:
showBranches: true
showCommitLabel: true
mainBranchName: 'normal'
---
gitGraph
commit id: "LB"
commit id: "Injected" type: HIGHLIGHT
commit id: "Backend Service"
branch fault
commit id: "Cloud Run"
commit id: "fault Container"
commit id: "Application Container"
checkout normal
merge fault id: "Rolled back" type: HIGHLIGHT
```
- [X] Create a basic Cloud Run service
You may want to follow the official [GCP documentation](https://cloud.google.com/run/docs/quickstarts/deploy-container) to deploy a sample service.
- [X] Upload the fault container image to a GCP artifactory
Cloud Run will expect the fault image to be pulled
from an artifactory in the same region (or a global one). So this means,
you must upload the official fault image to your
own artifactory repository.
Follow the [official documentation](https://cloud.google.com/artifact-registry/docs/docker/pushing-and-pulling#pushing) to upload the [fault image](https://github.com/rebound-how/rebound/pkgs/container/fault)
Something along the lines:
```bash
# locally download the official fault image
docker pull ghcr.io/fault-project/fault-cli:Hello, World!
Connected IP: 10.152.183.146 Total time: 0.315056s ``` This resolves both the proxy and the demo application from within the cluster, demonstrating a latency of roughly `315ms`. Once you exist the pod, its resources will be automatically released. ## Run fault's scenario as a Job - [X] Deploy fault's demo application in the cluster This steps serves only the purpose of demonstrating fault's working in a Kubernetes cluster. You can safely ignore it if you have another application you wish to try. ```yaml title="fault-demo.yaml" --- apiVersion: v1 kind: ServiceAccount metadata: name: fault-demo labels: app: fault-demo automountServiceAccountToken: false --- apiVersion: v1 kind: Service metadata: name: fault-demo labels: app: fault-demo spec: selector: app: fault-demo ports: - protocol: TCP port: 7070 targetPort: 7070 --- apiVersion: apps/v1 kind: Deployment metadata: name: fault-demo labels: app: fault-demo spec: replicas: 1 selector: matchLabels: app: fault-demo template: metadata: labels: app: fault-demo annotations: sidecar.istio.io/inject: "false" spec: serviceAccountName: fault-demo securityContext: runAsUser: 65532 runAsGroup: 65532 fsGroup: 65532 containers: - name: fault-demo image: rebound/fault:latest imagePullPolicy: Always tty: true args: - demo - run - "0.0.0.0" - "7070" ports: - containerPort: 7070 name: http securityContext: allowPrivilegeEscalation: false readOnlyRootFilesystem: true privileged: false capabilities: drop: - ALL ``` Apply it as follows: ```bash kubectl apply -f fault-demo.yaml ``` - [X] Load a fault scenario as a Kubernetes ConfigMap Let's play a simple scenario with a single test call executed 4 times in total: 12 baseline call without latency applied and three calls with latencies gradually increasing by `30ms` steps. ```yaml title="scenario.yaml" --- title: "Latency Increase By 30ms Steps From Downstream" description: "" scenarios: - call: method: GET url: http://fault-demo:7070/ping context: upstreams: - https://postman-echo.com faults: - type: latency mean: 80 stddev: 5 direction: ingress side: client strategy: mode: Repeat step: 30 count: 3 add_baseline_call: true expect: status: 200 response_time_under: 490 ``` To load this scenario as a configmap, run the next command: ```bash kubectl create configmap fault-scenario-file \ --from-file=scenario.yaml=scenario.yaml ``` - [X] Deploy fault's scenario as a Kubernetes Job Below is an example of running fault's scenarior as a job without retry. ```yaml title="fault-scenario.yaml" --- apiVersion: v1 kind: ServiceAccount metadata: name: fault-scenario labels: app: fault-scenario automountServiceAccountToken: false --- apiVersion: batch/v1 kind: Job metadata: name: fault-scenario labels: app: fault-scenario spec: backoffLimit: 0 # (1)! template: metadata: labels: app: fault-scenario annotations: sidecar.istio.io/inject: "false" spec: serviceAccountName: fault-scenario restartPolicy: Never securityContext: runAsUser: 65532 runAsGroup: 65532 fsGroup: 65532 containers: - name: fault-scenario image: rebound/fault:latest imagePullPolicy: Always tty: true args: - scenario - run - --scenario - rebound/scenario.yaml - --result - result.json # (2)! - --report - report.json # (3)! volumeMounts: - name: fault-scenario-file mountPath: /home/nonroot/rebound/scenario.yaml # (4)! readOnly: true securityContext: allowPrivilegeEscalation: false readOnlyRootFilesystem: false privileged: false capabilities: drop: - ALL volumes: - name: fault-scenario-file configMap: name: fault-scenario-file items: - key: scenario.yaml path: scenario.yaml ``` 1. Do not restart the job if it failed 2. Results contain the detailed events of the tests and all the applied faults 3. A report is a rough analysis of the results made by fault 4. Mount the scenario into the job's container Apply it as follows: ```bash kubectl apply -f fault-scenario.yaml ``` # Run fault on a Microsoft Windows host This guide will show you how to run fault on a Microsoft Windows host. ## What You'll Achieve You will learn how to run fault from a PowerShell command line or via the Windows Subsystem for Linux. ## Run fafaultult via Windows PowerShell - [X] Download fault for Windows Download the latest Windows release of fault from the [releases](https://github.com/rebound-how/rebound/releases/latest) page. - [X] Rename the binary Once downloaded, rename the executable to `fault.exe` - [X] Add the directory to the `Path` You may additionnaly update the `Path` so that fault is found. ```console $env:Path += ';C:\directoy\where\fault\lives' ``` ## Run fault via Windows Subsystem for Linux (WSL) - [X] Install a Ubuntu release Another approach to run from Windows is to benefit from the Windows [Substem for Linux](https://learn.microsoft.com/en-us/windows/wsl/setup/environment), which exposes Windows lower level resources in a way that allows Linux to run from them directly. ```powershell wsl --install -d Ubuntu-24.04 ``` This will install a base Ubuntu distribution. It will ask you for a username and password along the way. Finally, it will log you in to that user. - [X] Configure the environment Install the {==jq==} command: ```bash sudo apt install -y jq ``` Then, create the target directory where `fault` will be installed: ```bash mkdir -p .local/bin ``` Add the following to your `.bashrc` file: ```bash export PATH=$PATH:$HOME/.local/bin ``` - [X] Install fault Install fault using our installer script: ```bash curl -sSL https://fault-project.com/get | bash ``` # Run fault as a Docker Container This guide will show you how can you easily introduce network faults with Docker containers. !!! info fault container images are hosted on [GitHub Container Registry](https://github.com/rebound-how/rebound/pkgs/container/fault). They are [distroless](https://github.com/GoogleContainerTools/distroless) images available for amd64 and arm64 architectures. ## Run fault as A Container - [X] Pull the fault image ```bash docker pull ghcr.io/fault-project/fault-cli ``` !!! warning This image is based on distroless and embeds the static version of the `fault` cli which [doesn't support the AI Agent feature](../install.md#features-matrix). - [X] Run fault with a latency fault ```bash docker run \ -p 3180:3180 \ # (1)! --rm \ # (2)! -it \ # (3)! ghcr.io/fault-project/fault-cli \ run \ --proxy-address 0.0.0.0:3180 \ # (4)! --upstream http://192.168.1.3:7070 \ # (5)! --with-latency --latency-mean 300 ``` 1. Expose the proxy port if you need to access it from the host 2. Release the system resources once the container finishes 3. Give the process a terminal 4. The default behavior is to bind the proxy to the loopback which would prevent the proxy from being reached. Bind to all public interfaces with `0.0.0.0` 5. The address of the demo application we will apply the latency to - [X] Run the fault demo using the same image ```bash docker run \ -p 7070:7070 \ # (1)! rebound/fault \ demo run 0.0.0.0 # (2)! ``` 1. Expose the demo application port to the host 2. Run the demo server and bind to all container's interfaces - [X] Make a request to the demo application and see it impacted by the proxy ```bash curl \ -w "\nConnected IP: %{remote_ip}\nTotal time: %{time_total}s\n" \ -x http://localhost:3180 \ http://192.168.1.3:7070Hello, World!
Connected IP: ::1 Total time: 0.313161s ``` ## Run Stealh Mode in A Container !!! warning Stealth mode gives the opportunity to intercept traffic without having to explicitely set the proxy on the client. It relies on eBPF and therefore requires a lot of provileges which likely you would not have in a production environment. - [X] Pull the fault image ```bash docker pull ghcr.io/fault-project/fault-cli:0.15.0-stealth ``` !!! abstract We do not provide a container image with a `latest` tag for the {==stealth==} mode. You must provide a specific versionned tag. The one used in this documentation may be outdated, please check the [registry](https://github.com/rebound-how/rebound/pkgs/container/fault) for the newest version. - [X] Run fault with a latency fault ```bash docker run \ -p 3180:3180 \ # (1)! --rm \ # (2)! -it \ # (3)! --pid=host \ # (4)! -v /sys/fs/cgroup/:/sys/fs/cgroup/:ro \ # (5)! --cap-add=SYS_ADMIN \ # (6)! --cap-add=BPF \ # (7)! --cap-add=NET_ADMIN \ # (8)! ghcr.io/fault-project/fault-cli:0.15.0-stealth \ # (9)! run \ --stealth \ # (10)! --capture-process curl \ # (11)! --proxy-address 0.0.0.0:3180 \ # (12)! --with-latency --latency-mean 300 ``` 1. Expose the proxy port if you need to access it from the host 2. Release the system resources once the container finishes 3. Give the process a terminal 4. Share the host process namespace to access the client's process 5. Give access to the host's kernel resources for fault eBPF programs to attach to 6. Give too much power to the container but unfortunately we cannot reduce the scope so we need it 7. Specific BPF priviledges 8. fault needs quite a bit of access to networking to do its job 9. fault does not expose a `latest` tag for its eBPF-ready images. You must use a specific versionned tag. 10. Enable stealth mode and loads eBPF programs 11. Let's capture traffic coming from `curl` commands 12. The default behavior is to bind the proxy to the loopback which would prevent the proxy from being reached. Bind to all public interfaces with `0.0.0.0` - [X] Run the fault demo using the same image ```bash docker run \ -p 7070:7070 \ # (1)! rebound/fault \ demo run 0.0.0.0 # (2)! ``` 1. Expose the demo application port to the host 2. Run the demo server and bind to all container's interfaces - [X] Make a request to the demo application and see it impacted by the proxy ```bash curl \ -w "\nConnected IP: %{remote_ip}\nTotal time: %{time_total}s\n" \ http://192.168.1.3:7070Hello, World!
Connected IP: ::1 Total time: 0.313161s ``` Notice how we do not need to be explicit about routing traffic to the proxy by omitting setting `-x http://localhost:3180` # How to Simulate Bandwidth Constraints Using fault This guide shows you how to reduce or throttle network bandwidth in your application flow with fault. You’ll see examples of slowing traffic on the server side, client side, or both directions. ??? abstract "Prerequisites" - [X] Install fault If you haven’t installed fault yet, follow the [installation instructions](../../install.md). - [X] Basic Proxy Setup Be familiar with running `fault run` {==--with-[fault]==} commands from your terminal. ## Severe Upstream Slowdown In this scenario, server-side ingress traffic is heavily constrained, so data returning from the server becomes painfully slow for the client. Any responses from the server are throttled to 500 kbps, causing slow downloads or streaming on the client side. - [X] Start the proxy with bandwidth set from server-side ingress ```bash fault run \ --with-bandwidth \ # (1)! --bandwidth-side server \ # (2)! --bandwidth-direction ingress \ # (3)! --bandwidth-rate 500 \ # (4)! --bandwidth-unit kbps ``` 1. Enable the bandwidth fault support 2. Apply the fault on {==server==} side 3. Apply the fault on {==ingress==} 4. Set a very limited bandwidth to 500kbps ## Light Client Slowdown Here, you cap both inbound and outbound bandwidth on the client side, but only to a moderate level. The client’s uploads and downloads are each capped at `1 Mbps`. This tests how your app behaves if the client is the bottleneck. - [X] Start the proxy with bandwidth set from client-side both ingress and egress ```bash fault run \ --with-bandwidth \ # (1)! --bandwidth-side client \ # (2)! --bandwidth-direction both \ # (3)! --bandwidth-rate 1 \ # (4)! --bandwidth-unit mbps ``` 1. Enable the bandwidth fault support 2. Apply the fault on {==client==} side 3. Apply the fault on {==ingress==} and {==egress==} 4. Set a reduced bandwidth to 1mbps ## Throughput Degradation In this scenario, we combine ingress and egress on the server side, giving a moderate throughput limit of `2 Mbps`. This is helpful for general "server is maxing out" scenarios. Uploads and downloads from the server are capped at `2 Mbps`, simulating moderate network constraints on the server side. - [X] Start the proxy with bandwidth set from server-side both ingress and egress ```bash fault run \ --with-bandwidth \ # (1)! --bandwidth-side server \ # (2)! --bandwidth-direction both \ # (3)! --bandwidth-rate 2 \ # (4)! --bandwidth-unit mbps ``` 1. Enable the bandwidth fault support 2. Apply the fault on {==server==} side 3. Apply the fault on {==ingress==} and {==egress==} 4. Set a reduced bandwidth to 2mbps ## Mobile Edge / 3G‐Style Network Simulates a high‐latency, low‐throughput link. The user sees slow and sluggish performance typical of older mobile networks. - [X] Start the proxy with bandwidth and latency faults ```bash fault run \ --duration 10m \ --with-bandwidth \ # (1)! --bandwidth-side client \ --bandwidth-direction both \ --bandwidth-rate 384 \ --bandwidth-unit kbps \ --with-latency \ # (2)! --latency-mean 200 \ --latency-stddev 50 ``` 1. Both ingress and egress are capped to about 384 kbps (typical of older 3G) 2. Latency of ~200±50ms is layered on to reflect mobile edge behavior ## Next Steps - Combine with [Latency](./configure-latency.md): For a more realistic environment, layer static latency (`--with-latency`) plus bandwidth fault. # How to Blackhole Traffic Using fault This guide will walk you through emulating network severe degradation into your application using fault proxy capabilities. ??? abstract "Prerequisites" - [X] Install fault If you haven’t installed fault yet, follow the [installation instructions](../../install.md). - [X] Basic Proxy Setup Be familiar with running `fault run` {==--with-[fault]==} commands from your terminal. ## Completely Blackhole All Traffic In this scenario traffic is blackholed indefinitely and no packets will get through to its destination. The client or application will attempt to connect or send data but never receive a response, eventually timing out. - [X] Start the proxy with blackhole fault ```bash fault run --with-blackhole ``` ## Blackhole Traffic for Specific Time Windows Often, you want to simulate a partial outage - periods of normal traffic followed by complete blackhole intervals. - [X] Start the proxy with blackhole fault and a schedule ```bash fault run \ --duration 10m \ # (1)! --with-blackhole \ --blackhole-sched "start:10%,duration:50%;start:75%,duration:20%" # (2)! ``` 1. Run the proxy process for 10 minutes 2. At 10% of 10 minutes (the 1‐minute mark), start blackholing for 50% of total time (i.e., 5 minutes). Then, at 75% of 10 minutes (the 7.5‐minute mark), blackhole again for 20% of total time (2 minutes). Effect: * For the first minute, traffic flows normally. * Minutes 1–6: All traffic is blackholed (clients see no reply). * Minutes 6–7.5: Returns to normal. * Minutes 7.5–9.5: Blackhole again, finishing just before the proxy ends at 10 minutes. # How to Simulate HTTP Errors Using fault This guide will walk you through emulating application level HTTP errors into your application using fault proxy capabilities. ??? abstract "Prerequisites" - [X] Install fault If you haven’t installed fault yet, follow the [installation instructions](../../install.md). - [X] Basic Proxy Setup Be familiar with running `fault run` {==--with-[fault]==} commands from your terminal. !!! warning Currently HTTP errors can only be applied against HTTP proxy forwarding traffic. It doesn't work yet with tunneling traffic. The reason is that, when fault use the tunneling approach the network streams are opaque to fault. Therefore it cannot figure the protocol going though. One could write a [plugin](./extending.md) to achieve this but it's not a core feature yet. This HTTP error work against forward proxying but not tunneling proxy nor raw TCP proxies. ## Constant Internal Server Error - [X] Start the proxy with HTTP Error 500 from the remote server ```bash fault run \ --with-http-response \ # (1)! --http-response-status 500 \ # (2)! --http-response-trigger-probability 1 # (3)! ``` 1. Enable the HTTP error fault support 2. Set the {==status==} to 500 3. Set the error on all responses ## Intermittent Service Unavailable Errors - [X] Start the proxy with HTTP Error 503 from the remote server ```bash fault run \ --with-http-response \ # (1)! --http-response-status 503 \ # (2)! --http-response-trigger-probability 0.5 # (3)! ``` 1. Enable the HTTP error fault support 2. Set the {==status==} to 503 3. Set the error on half of the responses ## Intermittent Not Found Errors - [X] Start the proxy with HTTP Error 404 from the remote server ```bash fault \ --with-http-response \ # (1)! --http-response-status 404 \ # (2)! --http-response-trigger-probability 0.5 \ # (3)! --http-response-body '{"error": "true"}' # (4)! ``` 1. Enable the HTTP error fault support 2. Set the {==status==} to 404 3. Set the error on half of the responses 4. Set a JSON response body # How to Simulate Jitter Using fault This guide explains how to introduce variable latency (jitter) into your application flow. Jitter is random, short‐term fluctuations in latency that can disrupt real‐time communication or stream quality. ??? abstract "Prerequisites" - [X] Install fault If you haven’t installed fault yet, follow the [installation instructions](../../install.md). - [X] Basic Proxy Setup Be familiar with running `fault run` {==--with-[fault]==} commands from your terminal. ## Light Ingress Jitter In this example, incoming (ingress) traffic experiences a mild, random delay. Inbound data from the server to the client is randomly delayed by up to 30ms, repeated at a frequency of 5 times per second, causing mild but noticeable fluctuations. - [X] Start the proxy with jitter on ingress ```bash fault run \ --with-jitter \ # (1)! --jitter-amplitude 30 \ # (2)! --jitter-frequency 5 \ # (3)! --jitter-direction ingress # (4)! ``` 1. Enable the jitter fault support 2. Set the {==amplitude==} which the maximum random delay added to each packet 3. Set the {==frequency==} representing how often jitter is applied per second 4. Apply the fault on {==ingress==} ## Strong Egress Jitter Here, you impose a larger jitter on outbound traffic, simulating choppy sends from the client to the server. Outgoing data from the client can sporadically stall by up to `50ms`, repeated 10 times a second. This is a heavier jitter that can disrupt interactive or streaming client uploads. - [X] Start the proxy with jitter on egress ```bash fault run \ --with-jitter \ # (1)! --jitter-amplitude 50 \ # (2)! --jitter-frequency 10 \ # (3)! --jitter-direction egress # (4)! ``` 1. Enable the jitter fault support 2. Set the {==amplitude==} which the maximum random delay added to each packet 3. Set the {==frequency==} representing how often jitter is applied per second 4. Apply the fault on {==egress==} ## Bidirectional Jitter Here, all traffic, whether inbound or outbound, suffers random short spikes. This is great for testing two‐way real‐time apps. - [X] Start the proxy with jitter on egress and ingress ```bash fault run \ --with-jitter \ # (1)! --jitter-amplitude 30 \ # (2)! --jitter-frequency 8 \ # (3)! --jitter-direction both # (4)! ``` 1. Enable the jitter fault support 2. Set the {==amplitude==} which the maximum random delay added to each packet 3. Set the {==frequency==} representing how often jitter is applied per second 4. Apply the fault on {==egress==} and {==ingress==} ## Next Steps - Combine with [Latency](./configure-latency.md): For a more realistic environment, layer static latency (`--with-latency`) plus jitter for base latency + random spikes. - Vary the Frequency: If your application is bursty, reduce frequency for occasional stutters. - Apply Schedules: Use `--jitter-sched` to enable jitter in short intervals (e.g., [start:20%,duration:30%]), toggling unpredictably. By adjusting amplitude and frequency and applying them to ingress, egress, or both, you can simulate a wide spectrum of jitter conditions - from slight fluctuations to severe choppy networks. # How to Inject Latency into Your Flow with fault This guide shows how to delay traffic by a configurable amount, distribution, side (client or server), and direction (ingress or egress). You can simulate everything from a stable normal latency to heavy-tailed Pareto scenarios and selectively apply them to only client or server traffic. ??? abstract "Prerequisites" - [X] Install fault If you haven’t installed fault yet, follow the [installation instructions](../../install.md). - [X] Basic Proxy Setup Be familiar with running `fault run` {==--with-[fault]==} commands from your terminal. ## Normal Distribution A normal (Gaussian) distribution around a mean of `300ms` with a standard deviation of `40ms`. Most delays hover around `300ms`, but some are quicker/slower based on the bell curve. - [X] Start the proxy with a normal distribution latency ```bash fault run \ --with-latency \ # (1)! --latency-distribution normal \ # (2)! --latency-mean 300 \ # (3)! --latency-stddev 40 # (4)! ``` 1. Enable the latency fault support 2. Use the {==normal==} distribution 3. Introduce a latency of {==300ms==} on average 4. Add {==40ms==} standard deviation `±40 ms` ## Uniform Distribution A uniform distribution means every delay in `min..max` is equally likely. The added delay is anywhere between `300 / 500ms` without bias around a middle value. - [X] Start the proxy with a uniform distribution latency ```bash fault run \ --with-latency \ # (1)! --latency-distribution uniform \ # (2)! --latency-min 300 \ # (3)! --latency-max 500 # (4)! ``` 1. Enable the latency fault support 2. Use the {==uniform==} distribution 3. Introduce a latency of at least {==300ms==} 4. Set the maximum latency to {==500ms==} ## Pareto Distribution A Pareto distribution often creates a heavy‐tail, meaning most delays are small, but occasional extremely large spikes. You’ll see frequent short delays (`20ms` or so) but occasionally large outliers. - [X] Start the proxy with a Pareto distribution latency ```bash fault run \ --with-latency \ # (1)! --latency-distribution pareto \ # (2)! --latency-scale 20 \ # (3)! --latency-shape 1.5 # (4)! ``` 1. Enable the latency fault support 2. Use the {==pareto==} distribution 3. Set a scale of {==20ms==} 4. Set the shape of the distribution to {==1.5==} ## Pareto + Normal Hybrid Distribution Get a base normal offset of `~50±15ms`, plus a heavy‐tailed portion from the Pareto factors. - [X] Start the proxy with a Pareto + Normal distribution latency ```bash fault run \ --with-latency \ # (1)! --latency-distribution paretonormal \ # (2)! --latency-scale 20 \ # (3)! --latency-shape 1.5 \ # (4)! --latency-mean 50 \ # (5)! --latency-stddev 15 # (6)! ``` 1. Enable the latency fault support 2. Use the {==pareto==} distribution 3. Set a scale of {==20ms==} 4. Set the shape of the distribution to {==1.5==} 5. Set a mean of {==50ms==} on average 6. Standard deviation of {==15ms==} around that mean. ## Latency On Ingress Only Delay traffic from the server to the client. - [X] Start the proxy with any distribution and set the direction to {==ingress==}. ```bash fault run \ --with-latency \ # (1)! --latency-direction ingress \ # (2)! --latency-mean 50 ``` 1. Enable the latency fault support 2. Set the latency to take place in {==ingress==} ## Latency On Egress Only Delay traffic from the client to the server. - [X] Start the proxy with any distribution and set the direction to {==egress==}. ```bash fault run \ --with-latency \ # (1)! --latency-direction egress \ # (2)! --latency-mean 50 ``` 1. Enable the latency fault support 2. Set the latency to take place in {==egress==} ## Latency On Client-Side Only - [X] Start the proxy with any distribution and set the side to {==client==}. ```bash fault run \ --with-latency \ # (1)! --latency-side client \ # (2)! --latency-mean 50 ``` 1. Enable the latency fault support 2. Set the latency to take place on {==client==} side ## Latency On Server-Side Only - [X] Start the proxy with any distribution and set the side to {==server==}. ```bash fault run \ --with-latency \ # (1)! --latency-side server \ # (2)! --latency-mean 50 ``` 1. Enable the latency fault support 2. Set the latency to take place on {==server==} side ## Latency On Ingress From Server-Side Only - [X] Start the proxy with any distribution and set the direction to {==ingress==} and the side to {==server==}. ```bash fault run \ --with-latency \ --latency-direction ingress \ --latency-side server \ --latency-mean 50 ``` ## Next Steps - Scheduled Delays: Use `--latency-sched "start:20%,duration:30%"` to enable high latency for part of the total run. - Stacking: Combine latency with [jitter](configure-jitter.md) or [bandwidth](configure-bandwidth.md) constraints for a more realistic environment. - Extreme Spikes: Increase standard deviation or shape to stress test how your application handles sudden bursts of slowness. # How to Scramble your LLM communications with fault This guide shows you how to scramble LLM prompts and responses so that you may figure out how your application handles variations often observed with LLM. !!! abstract "Prerequisites" - [X] Install fault If you haven’t installed fault yet, follow the [installation instructions](../../install.md). - [X] Install and configure the `aichat` CLI Throughout this guide we will be using the [aichat](https://github.com/sigoden/aichat) CLI to handle our prompt examples. While fault works with any LLM client, `aichat` helps us keep this guide tight and clear. You may want to create a aichat config file that describes where to send requests trhough fault: ```yaml title="~/.config/aichat/config.yaml" model: openai:o4-mini-high clients: - type: openai-compatible # (1)! name: openai api_base: http://localhost:45580/v1 # (2)! api_key: ... # (3)! ``` 1. Tells aichat this applies to all requests using the OpenAI API. 2. The address of the proxy, the `/v1` path is necessary because the calls will be prefixed by it 3. Set a valid OpenAI API key !!! tip "Supported LLM providers" fault supports many LLM providers natively (OpenAI, Gemini, OpenRouter and ollama). The restriction for now is that we intercept and modify the [OpenAI chat completions API](https://platform.openai.com/docs/api-reference/chat) only. ## Scramble a prompt One of the most interesting feature from fault is its capacity to inject additional system prompts into a LLM query. Thi instruction will change the behavior from the LLM and therefore be valuable to explore. - [X] Inject a system prompt Make the LLM answer with a pirate tone: ```bash fault run llm openai --case prompt-scramble --instruction "Response as a pirate. Arr!" ``` This will launch fault and start a proxy listening on port 45580. To use it, simply swap your client's URL to point at the `http://localhost:45580`. All requests will be sent as-is to the right provider. - [X] Generate a random piece of code We may now send a prompt: ```bash aichat "Generate a python function that gives the time" ``` Below is its response. Note the vocabulary used to respond like a pirate. Yarrr! ```markdown Arrr, me hearty! Here’s a little Python function to fetch the current time for ye. Feel free to run it aboard yer own vessel: ```python def get_current_time(fmt='%Y-%m-%d %H:%M:%S'): """ Returns the current time as a formatted string. :param fmt: A datetime strftime-format string (default: 'YYYY-MM-DD HH:MM:SS') """ from datetime import datetime return datetime.now().strftime(fmt) ``` Usage be simple as swabbing the deck: >>> print(get_current_time()) 2024-06-15 14:23:08 Or specify yer own treasure-map of a format: >>> print(get_current_time('%H:%M:%S on %B %d, %Y')) 14:23:08 on June 15, 2024 Arr! That’ll keep ye shipshape with every tick of the clock. return f"Arr! The time be {datetime.datetime.now().strftime('%H:%M:%S')}" ``` ## Modify a prompt - [X] Modify a prompt Make the LLM answer with Java code instead of Python. ```bash fault run llm openai --case prompt-scramble --scramble-pattern python --scramble-with java ``` The pattern can be any valid regular expression. This will launch fault and start a proxy listening on port 45580. To use it, simply swap your client's URL to point at the `http://localhost:45580`. All requests will be sent as-is to the right provider. - [X] Generate a random piece of code We may now send a query: ```bash aichat -c "Generate a python function that gives the time" ``` Below is its response. Note how we get a Java snippet. ```markdown Here’s a small utility class that shows a few ways to “get the time” in Java 8+ using the java.time API: ```java import java.time.Instant; import java.time.LocalDateTime; import java.time.LocalTime; import java.time.ZoneId; import java.time.format.DateTimeFormatter; public class TimeUtil { /** * Returns the current LocalTime (hours/minutes/seconds/nanos). */ public static LocalTime getCurrentLocalTime() { return LocalTime.now(); } /** * Returns the current LocalDateTime (date + time). */ public static LocalDateTime getCurrentLocalDateTime() { return LocalDateTime.now(); } /** * Returns the current time as a formatted string, e.g. "15:42:07". * You can pass in any pattern you like, e.g. "HH:mm:ss", "yyyy-MM-dd HH:mm:ss", etc. */ public static String getCurrentTimeFormatted(String pattern) { DateTimeFormatter formatter = DateTimeFormatter.ofPattern(pattern); return LocalDateTime.now().format(formatter); } /** * Returns the current Unix timestamp (seconds since 1970-01-01T00:00:00Z). */ public static long getUnixTimestamp() { return Instant.now().getEpochSecond(); } /** * Returns the current timestamp in milliseconds. */ public static long getEpochMillis() { return Instant.now().toEpochMilli(); } public static void main(String[] args) { // Examples of usage: System.out.println("LocalTime = " + getCurrentLocalTime()); System.out.println("LocalDateTime = " + getCurrentLocalDateTime()); System.out.println("Formatted (HH:mm:ss) = " + getCurrentTimeFormatted("HH:mm:ss")); System.out.println("Formatted (full) = " + getCurrentTimeFormatted("yyyy-MM-dd HH:mm:ss")); System.out.println("Unix timestamp = " + getUnixTimestamp()); System.out.println("Epoch millis = " + getEpochMillis()); } } ``` Explanation of the key methods: * getCurrentLocalTime(): returns a LocalTime instance (no date). * getCurrentLocalDateTime(): returns a LocalDateTime (date + time). * getCurrentTimeFormatted(pattern): returns a String formatted according to the given pattern. * getUnixTimestamp(): seconds since the epoch (1970-01-01T00:00:00Z). * getEpochMillis(): milliseconds since the epoch. All of these use the modern java.time API, which is thread-safe and ISO-compliant. ``` ## Inject bias into a response In this use case, you can amend the response back from the server. - [X] Modify a prompt Make the LLM answer with Java code instead of Python. ```bash fault run llm openai --case inject-bias --bias-pattern "(?i)paris" --bias-replacement "London" ``` The pattern can be any valid regular expression. This will launch fault and start a proxy listening on port 45580. To use it, simply swap your client's URL to point at the `http://localhost:45580`. All requests will be sent as-is to the right provider. - [X] Run a prompt We may now send the following prompt: ```bash aichat "What is the average level of Sun per year of France's largest cities?" ``` Here is the response: ```markdown Below is an approximate ranking of France’s ten largest cities (by population) by their average annual sunshine, expressed in hours of bright sunshine per year. All figures refer to the 1981–2010 “climate‐normal” period as published by Météo-France: • Marseille (Pharo)………………2 784 h/year • Nice (Le Var)…………………2 701 h/year • Montpellier (Fréjorgues)…..2 621 h/year • Toulouse (Blagnac)……………2 057 h/year • Bordeaux (Mérignac)…………2 074 h/year • Lyon (Bron)………………………1 831 h/year • Nantes (Bouguenais)………1 795 h/year • Strasbourg (Entzheim)……1 700 h/year • London (Montsouris)……………1 662 h/year • Lille (Lesquin)………………1 477 h/year Key take-aways: – The sunniest of the major cities is Marseille (≈2 800 h), followed by Nice and Montpellier. – London, Lyon, Nantes and Strasbourg all hover in the 1 600–1 800 h range. – Lille has the lowest annual sunshine of the ten, with roughly 1 480 h/year. ``` Notice how {==Paris==} was renamed {==London==}. ## Slow the streamed response This use case is valuable to measure how your client deals with a slow streamed response. - [X] Slow the response by `800ms` per chunk ```bash fault run llm openai --case slow-stream --slow-stream-mean-delay 800 ``` This will launch fault and start a proxy listening on port 45580. To use it, simply swap your client's URL to point at the `http://localhost:45580`. All requests will be sent as-is to the right provider. - [X] Run a prompt We may now send a query: ```bash aichat "What is the average level of Sun per year of France's largest cities?" ``` You will notice each chunk takes some time to be displayed. # How to Simulate Packet Loss Using fault This How-To guide shows you how to configure fault so that a portion of your traffic is lost. You can keep a persistent level of packet loss or schedule it in specific bursts to test how your application handles intermittent unreliability. ??? abstract "Prerequisites" - [X] Install fault If you haven’t installed fault yet, follow the [installation instructions](../../install.md). - [X] Basic Proxy Setup Be familiar with running `fault run` {==--with-[fault]==} commands from your terminal. - [X] Check Available Packet Loss Strategies fault implements the Multi-State Markov strategy. Familiarize yourself with any advanced settings if needed. ## Constant Packet Loss In this scenario, fault starts with packet loss enabled throughout the entire proxy run. - [X] Start the proxy with packet loss on ingress from server side ```bash fault run --with-packet-loss ``` ## Scheduled Packet Loss Bursts - [X] Start the proxy with packet loss fo ```bash fault run \ --duration 10m \ --with-packet-loss \ --packet-loss-sched "start:5%,duration:20%;start:60%,duration:15%" # (1)! ``` 1. At 5% of 10 minutes (the 30-second mark), enable packet loss for 20% (2 minutes total). At 60% of 10 minutes (the 6-minute mark), enable packet loss again for 15% (1.5 minutes). Timeline: * Minutes 0–0.5: No loss (normal). * Minutes 0.5–2.5: Packet loss enabled (clients see up to some "lost" packets). * Minutes 2.5–6.0: Normal again. * Minutes 6.0–7.5: Packet loss resumes. * Remaining time to minute 10: No loss. ## Next Steps - Monitor Application Behavior: Track if clients adapt or retry effectively when some packets vanish. - Combine with Other Faults: For deeper reliability testing, mix packet loss with [latency](./configure-latency.md) or [bandwidth](configure-bandwidth.md) constraints. # Extend fault with gRPC Plugins fault's faults are internally managed by design. To support any bespoke scenarios you may need to explore, fault offers an extension mechanism via remote plugins. In this guide, you will learn how to create a simple echo plugin before moving to a more advanced use case by analyzing SQL queries on the fly. ??? abstract "Prerequisites" - [X] Install fault If you haven’t installed fault yet, follow the [installation instructions](../../install.md). - [X] Python 3 While the guides here use Python as a demonstration. You may choose any language that has a good support for gRPC, which basically means most modern languages today. ## Register Plugins Before you create your first plugin, let's review how they are registered with fault's proxy. Use the `--grpc-plugin` flag, multiple times one for each plugin, on the `fault run` command: ```bash fault run --grpc-plugin http://localhost:50051 --grpc-plugin http://localhost:50052 ... ``` ??? note "Plugin connection management" fault will tolerate plugins to disconnect and will attempt to reconnect to a plugin that went away. ## Create a Basic Plugin with Python ??? question "Are plugins only written in Python?" fault's plugins are gRPC servers so you can write plugins in any languages that [support gRPC](https://grpc.io/docs/#official-support). We use Python here but feel free to adjust to your own personal preferences. - [X] Get the fault gRPC protocol file Download the [gRPC protocol file](https://github.com/rebound-how/rebound/blob/main/fault/fault-cli/src/plugin/rpc/protos/plugin.proto) on your machine. - [X] Install the Python dependencies with `uv` === "pip" ```bash pip install grpcio-tools ``` === "uv" ```bash uv tool install grpcio-tools ``` - [X] Generate the gRPC Python implementation from the Protocol file ```bash python -m grpc_tools.protoc \ # (1)! --python_out=. --grpc_python_out=. \ # (2)! -I . \ # (3)! plugin.proto # (4)! ``` 1. Execute the gRPC tool to convert the protocol file into a Python source file 2. The directory where to save the generated modules 3. The include directory, this is the directory where the `plugin.proto` file lives 4. The fault protocol file you just downloaded This command should generate two files: * `plugin_pb2_grpc.py` the gRPC client and server classes * `plugin_pb2.py` the protocol buffer definitions - [X] Create your echo remote plugin Now that you have generated the Python modules implemtning the plugin protocol definition, you can implement your first plugin. ```python title="plugin.py" import time from concurrent import futures import grpc # Import the generated gRPC classes import plugin_pb2 import plugin_pb2_grpc class EchoPlugin(plugin_pb2_grpc.PluginServiceServicer): def HealthCheck(self, request, context): """Returns the current status of the plugin.""" return plugin_pb2.HealthCheckResponse( healthy=True, message="" ) def GetPluginInfo(self, request, context): """Returns plugin metadata.""" return plugin_pb2.GetPluginInfoResponse( name="EchoPlugin", version="1.0.0", author="John Doe", url="https://github.com/johndoe/echoplugin", platform="python", ) def GetPluginCapabilities(self, request, context): """ Returns the capabilities of this plugin. Capabilities define the features supported by this plugin. Here, our echo plugin supports all of them. """ return plugin_pb2.GetPluginCapabilitiesResponse( can_handle_http_forward=True, # support HTTP forwarding can_handle_tunnel=True, # support HTTP tunneling protocols=[] # support any TCP protocol ) def ProcessHttpRequest(self, request, context): """ Processes an incoming HTTP request. In this example we simply echo the request back, indicating no modification. """ print(request.request) return plugin_pb2.ProcessHttpRequestResponse( action=plugin_pb2.ProcessHttpRequestResponse.Action.CONTINUE, modified_request=request.request, ) def ProcessHttpResponse(self, request, context): """ Processes an outgoing HTTP response. Here, we simply pass the response through unchanged. """ print(request.response) return plugin_pb2.ProcessHttpResponseResponse( action=plugin_pb2.ProcessHttpResponseResponse.Action.CONTINUE, modified_response=request.response, ) def ProcessTunnelData(self, request, context): """ Processes a chunk of tunnel (TCP/TLS) data. """ # chunk is a piece of the stream as bytes print(request.chunk) return plugin_pb2.ProcessTunnelDataResponse( action=plugin_pb2.ProcessTunnelDataResponse.Action.PASS_THROUGH, modified_chunk=request.chunk, ) def serve(): # Create a gRPC server with a thread pool. server = grpc.server(futures.ThreadPoolExecutor(max_workers=10)) # Register the service. plugin_pb2_grpc.add_PluginServiceServicer_to_server(EchoPlugin(), server) port = 50051 server.add_insecure_port(f'[::]:{port}') server.start() print(f"Plugin gRPC server is running on port {port}...") try: # Keep the server running indefinitely. while True: time.sleep(86400) except KeyboardInterrupt: print("Shutting down server...") server.stop(0) if __name__ == '__main__': serve() ``` !!! note This code does not have any typing set on the variables and functions because the gRPC Python generator does not support them yet. This [issue](https://github.com/grpc/grpc/issues/29041) is a good place to track the effort towards adding typing. - [X] Run your echo plugin ```bash python plugin.py ``` The plugin now listens on port `50051` - [X] Start the fault's demo server ```bash fault demo run ``` We'll send traffic to this server via the proxy as an example of a target endpoint. Of course, you can use any server of your choosing. - [X] Use the echo plugin with fault ```bash fault run --grpc-plugin http://localhost:50051 --with-latency --latency-mean 300 --upstream '*' ``` Use fault as you would without the plugin. All the other flags support work the same way. Here fault will forward traffic to your plugin but also apply the latency fault. - [X] Explore the plugin's behavior First, let's use the forward proxy: ```bash curl -x http://localhost:3180 http://localhost:7070 ``` This will show the request and responses in the plugin's console window. Next, let's use the tunnel proxy: ```bash curl -x http://localhost:3180 http://localhost:7070 -p ``` This will show the stream of data as bytes as received by the plugin. ## Intercept PostgreSQL Messages This guide will show you how to intercept the low-level [PostgreSQL wire format](https://www.postgresql.org/docs/current/protocol-message-formats.html) to parse some messages. This could be a skeletton to change the values returned by the database and observe the impacts on your application. - [X] Get the fault gRPC protocol file Download the [gRPC protocol file](https://github.com/rebound-how/rebound/blob/main/fault/fault-cli/src/plugin/rpc/protos/plugin.proto) on your machine. - [X] Install the Python dependencies with `uv` === "pip" ```bash pip install grpcio-tools ``` === "uv" ```bash uv tool install grpcio-tools ``` - [X] Generate the gRPC Python implementation from the Protocol file ```bash python -m grpc_tools.protoc \ # (1)! --python_out=. --grpc_python_out=. \ # (2)! -I . \ # (3)! plugin.proto # (4)! ``` 1. Execute the gRPC tool to convert the protocol file into a Python source file 2. The directory where to save the generated modules 3. The include directory, this is the directory where the `plugin.proto` file lives 4. The fault protocol file you just downloaded This command should generate two files: * `plugin_pb2_grpc.py` the gRPC client and server classes * `plugin_pb2.py` the protocol buffer definitions - [X] Create your remote plugin Now that you have generated the Python modules implementing the plugin protocol definition, you can implement your plugin. !!! warning We are using Python again for this plugin. In a real scenario, we suggest you use rust here as Python does not have a native library that parses the PostgreSQL wire format. For the purpose of this guide, we write a few helper functions but they are a bit fragile. If you wanted something more robust, we could suggest you use rust + [pgwire](https://github.com/sunng87/pgwire). ```python title="plugin.py" import struct import time from concurrent import futures import uuid import grpc import plugin_pb2 import plugin_pb2_grpc ############################################################################### # Our PostgreSQL plugin # We only implement the necessary entrypoints # * the healthcheck # * the metadata info # * the capabilitues of the plugin # * any streamed data from and to the PostgreSQL server ############################################################################### class PostgreSQLPluginService(plugin_pb2_grpc.PluginServiceServicer): def HealthCheck(self, request, context): """Returns the current status of the plugin.""" return plugin_pb2.HealthCheckResponse( healthy=True, message="" ) def GetPluginInfo(self, request, context): """Returns plugin metadata.""" return plugin_pb2.GetPluginInfoResponse( name="PostgreSQLPlugin", version="1.0.0", author="John Doe", url="https://github.com/johndoe/echoplugin", platform="python", ) def GetPluginCapabilities(self, request, context): """Returns the capabilities of this plugin.""" return plugin_pb2.GetPluginCapabilitiesResponse( can_handle_http_forward=False, can_handle_tunnel=False, protocols=[ plugin_pb2.GetPluginCapabilitiesResponse.SupportedProtocol.POSTGRESQL ] ) def ProcessTunnelData(self, request, context): """ Processes a chunk of tunnel (TCP/TLS) data and parse it as a PostgreSQL message (at least the ones we are interested in). Essentially we parse the simple query sent by the client and the response from the server. We do not do anything with these messages but in a real scenario, you could change the returned values to trigger a fault from your application) """ try: # you can use this id to discriminate streams later on stream_id = parse_stream_id(request.id) print(f"Stream id {stream_id}") print(parse_messages(stream_id, request.chunk)) except Exception as x: print(x) # we have processed the chunk, now let's return it as-is to continue # its life in the proxy return plugin_pb2.ProcessTunnelDataResponse( pass_through=plugin_pb2.PassThrough(chunk=request.chunk) ) ############################################################################### # A few helper functions to parse some of the messages we are interested in # to read from the PostgreSQL wire format # https://www.postgresql.org/docs/current/protocol-message-formats.html ############################################################################### def parse_stream_id(stream_id: str) -> uuid.UUID: return uuid.UUID(stream_id, version=4) def parse_row_description(data: bytes) -> dict: """ Parse a PostgreSQL RowDescription (type 'T') message from raw bytes. Returns a dictionary with keys: { "field_count": int, "fields": [ { ... per-field metadata ... }, ... ] } Raises ValueError if the message is malformed. """ if not data or data[0] != 0x54: # 'T' = 0x54 return if len(data) < 5: raise ValueError("Data too short to contain RowDescription length") if len(data) < 7: raise ValueError("Data too short to contain RowDescription field_count") field_count = struct.unpack_from(">H", data, 5)[0] offset = 7 fields = [] for _ in range(field_count): # Parse one field field, offset = parse_field_description(data, offset) fields.append(field) return { "field_count": field_count, "fields": fields, } def parse_field_description(data: bytes, offset: int) -> tuple[dict, int]: """ Parse a single FieldDescription from 'data' starting at 'offset'. Returns (field_dict, new_offset). A FieldDescription has: - name (null-terminated string) - table_oid (Int32) - column_attr (Int16) - type_oid (Int32) - type_len (Int16) - type_mod (Int32) - format_code (Int16) """ # Read field name (null-terminated) name, offset = read_null_terminated_string(data, offset) # We now read 18 bytes of metadata: # 4 + 2 + 4 + 2 + 4 + 2 if offset + 18 > len(data): raise ValueError("Data too short for field metadata") table_oid, column_attr, type_oid, type_len, type_mod, format_code = struct.unpack_from( ">ihihih", data, offset ) offset += 18 # Build a dictionary representing this field field_dict = { "name": name, "table_oid": table_oid, "column_attr": column_attr, "type_oid": type_oid, "type_len": type_len, "type_mod": type_mod, "format_code": format_code, } return field_dict, offset def parse_row_data(data: bytes) -> dict: """ Parse a PostgreSQL DataRpw (type 'B') message from raw bytes. Returns a dictionary with keys: { "field_count": int, "fields": [ { ... per-field metadata ... }, ... ] } Raises ValueError if the message is malformed. """ if not data or data[0] != 0x44: # 'D' = 0x44 return if len(data) < 5: raise ValueError("Data too short to contain DataRow length") if len(data) < 7: raise ValueError("Data too short to contain DataRow field_count") field_count = struct.unpack_from(">H", data, 5)[0] offset = 7 fields = [] for _ in range(field_count): # Parse one field field, offset = parse_field_data(data, offset) fields.append(field) return { "field_count": field_count, "fields": fields, } def parse_field_data(data: bytes, offset: int) -> tuple[dict, int]: """ Parse a single FieldData from 'data' starting at 'offset'. Returns (field_dict, new_offset). A FieldData has: - length (Int32) - bytes """ offset += 2 length = struct.unpack_from(">i", data, offset)[0] offset += 4 if length == -1: value = None else: value = data[offset:offset+length] offset += length # Build a dictionary representing this field field_dict = { "length": length, "value": value, } return field_dict, offset def read_null_terminated_string(data: bytes, offset: int) -> tuple[str, int]: """ Reads a null-terminated UTF-8 (or ASCII) string from 'data' at 'offset'. Returns (string, new_offset). Raises ValueError if a null byte isn't found before the end of 'data'. """ start = offset while offset < len(data): if data[offset] == 0: raw_str = data[start:offset] offset += 1 # move past the null terminator try: return raw_str.decode("utf-8"), offset except UnicodeDecodeError: raise ValueError("Invalid UTF-8 in field name") offset += 1 raise ValueError("Missing null terminator in field name") def parse_messages(stream_id: uuid.UUID, data: bytes): offset = 0 messages = [] while offset < len(data): if offset + 5 > len(data): raise ValueError("Not enough bytes for message type+length") msg_type = data[offset] offset += 1 length = struct.unpack_from(">i", data, offset)[0] offset += 4 end = offset + (length - 4) if end > len(data): raise ValueError("Truncated message: length beyond data boundary") payload = data[offset:end] offset = end if msg_type == 0x54: # 'T' # Rebuild a T message chunk: 1 byte + 4 byte length + +2 byte field count + payload fields_count = struct.unpack_from(">H", data, 5)[0] row_desc_msg = bytes([msg_type]) + struct.pack(">i", length) + struct.pack(">H", fields_count) + payload row_desc = parse_row_description(row_desc_msg) messages.append(("RowDescription", row_desc)) elif msg_type == 0x44: # 'D' DataRow fields_count = struct.unpack_from(">H", data, 5)[0] row_data_msg = bytes([msg_type]) + struct.pack(">i", length) + struct.pack(">H", fields_count) + payload row_data = parse_row_data(row_data_msg) messages.append(("DataRow", row_data)) elif msg_type == 0x43: # 'C' CommandComplete messages.append(("CommandComplete", payload)) elif msg_type == 0x5A: # 'Z' ReadyForQuery messages.append(("ReadyForQuery", payload)) elif msg_type == 0x51: # 'Q' Query messages.append(("Query", payload)) else: messages.append((f"Unknown({hex(msg_type)})", payload)) return messages def serve(): # Create a gRPC server with a thread pool. server = grpc.server(futures.ThreadPoolExecutor(max_workers=10)) # Register the service. plugin_pb2_grpc.add_PluginServiceServicer_to_server(PostgreSQLPluginService(), server) port = 50051 server.add_insecure_port(f'[::]:{port}') server.start() print(f"Plugin gRPC server is running on port {port}...") try: # Keep the server running indefinitely. while True: time.sleep(86400) except KeyboardInterrupt: print("Shutting down server...") server.stop(0) if __name__ == '__main__': serve() ``` - [X] Run your plugin ```bash python plugin.py ``` The plugin now listens on port `50051` - [X] Start a PosgtreSQL server with docker ```bash docker run --name postgres -p 5432:5432 -e POSTGRES_DB=demo \ -e POSTGRES_USER=demo -e POSTGRES_PASSWORD=demo --rm -it postgres ``` - [X] Start a PosgtreSQL client with docker ```bash docker run --rm -it postgres psql -U demo \ -h localhost \ # (1)! -p 9098 # (2)! ``` 1. The address of the proxy 2. The port of the proxy since we route our traffic via the proxy - [X] Use the plugin with fault ```bash fault run --grpc-plugin http://localhost:50051 \ # (1)! --proxy "9098=psql://192.168.1.45:5432" # (2)! ``` 1. Connect to the plugin 2. Map a local proxy from port {==9098==} to the address of the database server {==192.168.1.45:5432==}. Obviously change the actual IP to the one matching your database. - [X] Explore the plugin's behavior From the PostgreSQL client, you can now type a SQL query such as: ```sql select now(); ``` The plugin will echo the parsed messages. Something along the lines: ```python [('Query(0x51)', b'select now();\x00')] [('RowDescription', {'field_count': 1, 'fields': [{'name': '', 'table_oid': 24014711, 'column_attr': 0, 'type_oid': 0, 'type_len': 0, 'type_mod': 303104, 'format_code': 2303}]}), ('DataRow', {'field_count': 1, 'fields': [{'length': 29, 'value': b'2025-04-08 20:24:43.111173+00'}]}), ('CommandComplete', b'SELECT 1\x00'), ('ReadyForQuery', b'I')] ``` As a next step, we could use [sqlglot](https://github.com/tobymao/sqlglot) to parse the query and, for instance, change it on the fly. The goal is to evaluate how the application reacts to variation from the database. # Proxy Lifecycle ## Duration The default behavior of the fault's proxy is to run indefinitely. You may change that by setting the `--duration` flag with a value in seconds. Once this duration has been reached, the proxy will automatically terminates. ```bash fault run --duration 10m ... ``` The flag supports a variety of [units](https://docs.rs/parse_duration/latest/parse_duration/#units) to express the duration more conveniently. Setting the duration has a nice side-effect that the scheduling of fault injections can be declared relatively to this duration. For instance: ```bash fault run --duration 5m --latency-sched "start:5%;duration:30%;start:90%,duration:5%" ``` * fault will run for `5 minutes` * A first wave of latency will start after `15s` and run for `90s` * A second wave of latency will start after `270s` and run for `15s` When a duration is set, fault displays a progress bar: ```bash ⠏ Progress: ------------------------------------------🐢-------- 🏁 ``` ## Scheduling fault applies faults for the entire duration of the run by default. You may change this by setting a schedule for each enabled fault. A schedule defines a sequence of {==start, duration==} for the fault. These values describe ranges when a particular fault should be enabled. The rest of the time, the fault is disabled. The {==start==} and {==duration==} should be either fixed, and set in seconds, of relative and set as a percentage of the total runtime. In that latter case, you must pass the total duration via `--duration`. Mixing relative and fixed schedules is supported. !!! note Relative scheduling is declared using percentages of the total duration. It is not a ratio of seen requests. !!! example "Fixed Schedule" ```bash fault run \ ... \ --latency-sched "start:20s,duration:40s;start:80s,duration:30s" \ ... --bandwidth-sched "start:35s,duration:20s" ```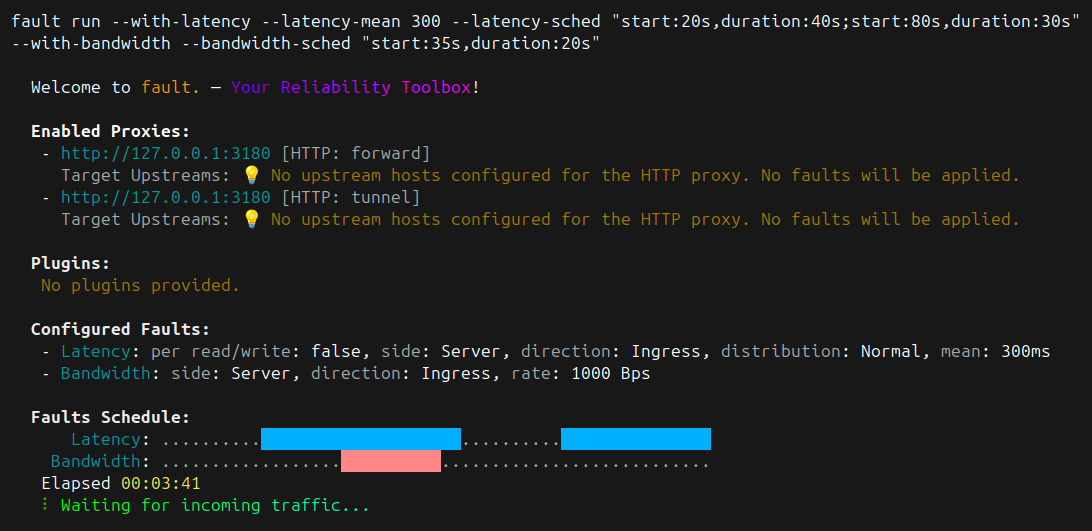 !!! example "Relative Schedule"
```bash
fault run --duration 5m \
... \
--latency-sched "start:5%,duration:30%;start:90%,duration:5%" \
... \
--bandwidth-sched "start:125s,duration:20s;start:70%,duration:5%"
```
!!! example "Relative Schedule"
```bash
fault run --duration 5m \
... \
--latency-sched "start:5%,duration:30%;start:90%,duration:5%" \
... \
--bandwidth-sched "start:125s,duration:20s;start:70%,duration:5%"
```
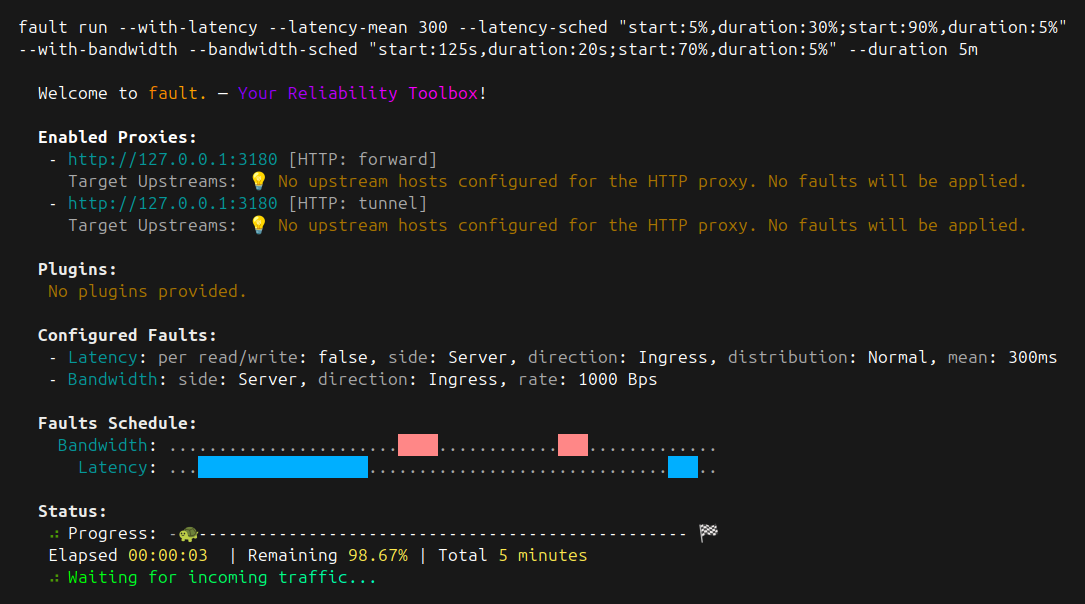 # How to Simulate Network Faults On Any TCP-based Traffic
This guide shows you how to use fault to simulate network faults on any
TCP-oriented network traffic, even with TLS encryption.
??? abstract "Prerequisites"
- [X] Install fault
If you haven’t installed fault yet, follow the
[installation instructions](../../install.md).
- [X] Basic Proxy Setup
Be familiar with running `fault run` {==--with-[fault]==} commands from
your terminal.
- [X] Understanding of TCP Proxying
Explore the [TCP proxy protocol reference](../../../reference/proxy-mapping-syntax.md).
??? question "Do I still need `HTTP_PROXY` or `HTTPS_PROXY`?"
When you setup a proxy, you are effectively swapping your target
address with the proxy's address in your application. You do not need to
set the standard these environment variables.
??? question "What about encryption?"
The traffic from the client to the proxy is in clear. From the proxy
to the target host, the traffic is encrypted if the endpoint expects
it to be.
A future version of fault may allow to encrypt the traffic between
client and proxy as well with your own certificate.
## Create a Dedicated TCP Proxy
fault can create any number of proxies that can be used as endpoints by
your applications to experiment with network fault impacts.
- [X] Start a proxy on port `9098`
```bash
fault run \
--proxy "9098=https://www.google.com:443" \ # (1)!
--with-latency \
--latency-mean 300
```
1. Make sure to set a host and its port. fault cannot figure it out.
You can use as many `--proxy` flags as needed. fault will start
listening on port {==9098==} for TCP connections. Any network going to that
the address {==0.0.0.0:9098==} will be transmitted to the endpoint, here
`https://www.google.com`. fault will apply any faults you have setup to the
traffic. Please read the
[reference](../../../reference/proxy-mapping-syntax.md#grammar). for the supported
definition of the proxy protocol.
- [X] Make a request to the endpoint via our proxy
```bash
curl \
-4 \ # (1)!
-H "Host: www.google.com" \ # (2)!
-I \
-o /dev/null -s \
-w "Connected IP: %{remote_ip}\nTotal time: %{time_total}s\n" \
https://0.0.0.0:9098 # (3)!
```
1. fault's proxy only support IPv4 for now. That my change in the future.
2. Make sure the `Host` headers matches the actual target server.
3. Instead of connecting to `https://www.google.com`, we connect to the
proxy and let it forward our HTTP request to `https://www.google.com`
on our behalf.
Note that the proxy doesn't make a request, the traffic sent by curl is
sent as-is (aside from the network faults) to the final target endpoint.
## Simulate Network Faults on PostgreSQL Traffic
While you may benefit from learning how network faults impact your application
at the API (often HTTP) level, it may also be valuable to explore effects from
dependencies such as traffic between your application and its database.
- [X] Start a proxy on port `35432`
```bash
fault run \
--proxy "35432=localhost:5432" \ # (1)!
--with-latency \
--latency-mean 800 \ # (2)!
--latency-per-read-write # (3)!
```
1. Let's assume the database is local and listening on port `5432`.
Change to match your system.
2. Let's use a fairly high latency to notice it
3. The default for latency faults is to be applied only once in the
life of the connection. With `--latency-per-read-write` you tell fault
to apply the fault on any read or write operation. This is useful
here for our example because we will connect with {==psql==} and without
this flag, the latency would be applied only once at connection time.
- [X] Connect with {==psql==} to the PostgreSQL server via fault's proxy
```bash
psql -h localhost \ # (1)!
-p 35432 \ # (2)!
-U demo \ # (3)!
-d demo # (4)!
```
1. The address of your the fault's proxy. You may use `localhost` here or
a non-loopback address since the proxy is bound to all interfaces with
`0.0.0.0`
2. The proxy's port
3. The username to connect to the server, adjust to your own system
4. The database name, adjust to your own system
Once you are connected, any query made to the server will go through the
proxy which will apply the configured network faults to it.
# Intercept Network Traffic Transparently
This guide will walk you through enabling fault's {==stealth mode==} to capture
network traffic without modifying your application.
!!! warning "This feature requires eBPF and a Linux host"
This feature is only available on Linux as it relies on a kernel
advanced capability called
[ebpf](../../../explanations/understanding-ebpf.md).
??? abstract "Prerequisites"
- [X] Install fault with Stealth mode support
If you haven’t installed fault yet, follow the
[installation instructions](../../install.md#stealth-feature).
## Capture HTTPS Traffic
- [X] Start the proxy in stealth mode with a normal distribution latency
```bash
fault run \
--stealth \ # (1)!
--capture-process curl \ # (2)!
--with-latency \ # (3)!
--latency-mean 300 \
--latency-stddev 40
```
1. Enable stealth mode
2. Stealth mode will focus only on processes named `curl`
3. Enable the latency fault support
- [X] Send traffic
```bash
curl \
-4 \ # (1)!
-I \ # (2)!
-o /dev/null -s \ # (3)!
-w "Connected IP: %{remote_ip}\nTotal time: %{time_total}s\n" \ # (4)!
https://www.google.com
```
1. fault can only intercept IPv4 traffic
2. Let's only focus on a HEAD request for brevety
3. Discard any returned output
4. Display statistics about the call
## Apply Latency to a PostgreSQL Connection
- [X] Install fault's ebpf dependencies
Follow the procedure to
[install](../../install.md#stealth-feature) the
eBPF programs on your machine.
- [X] Start a local PostgreSQL server using a container
```bash
docker run \
--name demo-db \ # (1)!
-e POSTGRES_USER=demo \ # (2)!
-e POSTGRES_PASSWORD=demo \ # (3)!
-e POSTGRES_DB=demo \ # (4)!
--rm -it \ # (5)!
-p 5432:5432 \ # (6)!
postgres
```
1. Name of the container, useful to identify and delete it later on
2. Default basic user named {{==demo==}}
3. Password set to {{==demo==}} for the user {{==demo==}}
4. Default database name
5. Release all resources once we stop the container
6. Expose the database port onto the host
- [X] Start the proxy in stealth mode with a normal distribution latency
```bash
fault run \
--stealth \ # (1)!
--capture-process curl \ # (2)!
--with-latency \ # (3)!
--latency-mean 300 \
--latency-stddev 40
```
1. Enable stealth mode
2. Stealth mode will focus only on processes named `curl`
3. Enable the latency fault support
- [X] Communicate with your PostgreSQL server
First, install `uv` to run the demonstration script below. Follow the
instructions from the
[uv documentation](https://docs.astral.sh/uv/getting-started/installation/).
Let's use the following basic Python script:
```python title="connect-to-pgsql.py"
import time
import psycopg
def query_database_server_time(url: str) -> None:
start = time.time()
with psycopg.Connection.connect(url) as conn: # (1)!
cur = conn.execute("select now()")
print(cur.fetchone()[0])
print(f"Time taken {time.time() - start}")
if __name__ == "__main__":
connection_url = "postgresql://demo:demo@localhost:5432/demo" # (2)!
query_database_server_time(connection_url)
```
1. We are using a context manager which closes the connection automatically
2. This should reflect the address of your PostgreSQL database
Run the script using `uv`.
```bash
uv run \ # (1)!
--with psycopg[binary] \ # (2)!
python connect-to-pgsql.py
```
1. Use {==uv==} to run the script with the required dependency
2. Install the required dependency on the fly. Here the {==psycopg==} driver
This should output something such as:
```bash
2025-03-08 13:06:16.968350+00:00
Time taken 0.30957818031311035 # (1)!
```
1. This shows the impact of the latency injected by fault into the exchange
!!! info
We use `uv` to ease the management of the Python environment for this
particular script. When we run the script this way, the actual process
executing the script is indeed `python`. This is why fault captures
the network traffic from the `python` process, not from `uv`.
# Configure the TUI
fault is a CLI. But it doesn't mean it shouldn't display the information with
a beautiful TUI (Terminal User Interface).
## Default TUI
The default TUI mode shows a summary of the configuration you set for the proxy
and a summary of the events it sees:
# How to Simulate Network Faults On Any TCP-based Traffic
This guide shows you how to use fault to simulate network faults on any
TCP-oriented network traffic, even with TLS encryption.
??? abstract "Prerequisites"
- [X] Install fault
If you haven’t installed fault yet, follow the
[installation instructions](../../install.md).
- [X] Basic Proxy Setup
Be familiar with running `fault run` {==--with-[fault]==} commands from
your terminal.
- [X] Understanding of TCP Proxying
Explore the [TCP proxy protocol reference](../../../reference/proxy-mapping-syntax.md).
??? question "Do I still need `HTTP_PROXY` or `HTTPS_PROXY`?"
When you setup a proxy, you are effectively swapping your target
address with the proxy's address in your application. You do not need to
set the standard these environment variables.
??? question "What about encryption?"
The traffic from the client to the proxy is in clear. From the proxy
to the target host, the traffic is encrypted if the endpoint expects
it to be.
A future version of fault may allow to encrypt the traffic between
client and proxy as well with your own certificate.
## Create a Dedicated TCP Proxy
fault can create any number of proxies that can be used as endpoints by
your applications to experiment with network fault impacts.
- [X] Start a proxy on port `9098`
```bash
fault run \
--proxy "9098=https://www.google.com:443" \ # (1)!
--with-latency \
--latency-mean 300
```
1. Make sure to set a host and its port. fault cannot figure it out.
You can use as many `--proxy` flags as needed. fault will start
listening on port {==9098==} for TCP connections. Any network going to that
the address {==0.0.0.0:9098==} will be transmitted to the endpoint, here
`https://www.google.com`. fault will apply any faults you have setup to the
traffic. Please read the
[reference](../../../reference/proxy-mapping-syntax.md#grammar). for the supported
definition of the proxy protocol.
- [X] Make a request to the endpoint via our proxy
```bash
curl \
-4 \ # (1)!
-H "Host: www.google.com" \ # (2)!
-I \
-o /dev/null -s \
-w "Connected IP: %{remote_ip}\nTotal time: %{time_total}s\n" \
https://0.0.0.0:9098 # (3)!
```
1. fault's proxy only support IPv4 for now. That my change in the future.
2. Make sure the `Host` headers matches the actual target server.
3. Instead of connecting to `https://www.google.com`, we connect to the
proxy and let it forward our HTTP request to `https://www.google.com`
on our behalf.
Note that the proxy doesn't make a request, the traffic sent by curl is
sent as-is (aside from the network faults) to the final target endpoint.
## Simulate Network Faults on PostgreSQL Traffic
While you may benefit from learning how network faults impact your application
at the API (often HTTP) level, it may also be valuable to explore effects from
dependencies such as traffic between your application and its database.
- [X] Start a proxy on port `35432`
```bash
fault run \
--proxy "35432=localhost:5432" \ # (1)!
--with-latency \
--latency-mean 800 \ # (2)!
--latency-per-read-write # (3)!
```
1. Let's assume the database is local and listening on port `5432`.
Change to match your system.
2. Let's use a fairly high latency to notice it
3. The default for latency faults is to be applied only once in the
life of the connection. With `--latency-per-read-write` you tell fault
to apply the fault on any read or write operation. This is useful
here for our example because we will connect with {==psql==} and without
this flag, the latency would be applied only once at connection time.
- [X] Connect with {==psql==} to the PostgreSQL server via fault's proxy
```bash
psql -h localhost \ # (1)!
-p 35432 \ # (2)!
-U demo \ # (3)!
-d demo # (4)!
```
1. The address of your the fault's proxy. You may use `localhost` here or
a non-loopback address since the proxy is bound to all interfaces with
`0.0.0.0`
2. The proxy's port
3. The username to connect to the server, adjust to your own system
4. The database name, adjust to your own system
Once you are connected, any query made to the server will go through the
proxy which will apply the configured network faults to it.
# Intercept Network Traffic Transparently
This guide will walk you through enabling fault's {==stealth mode==} to capture
network traffic without modifying your application.
!!! warning "This feature requires eBPF and a Linux host"
This feature is only available on Linux as it relies on a kernel
advanced capability called
[ebpf](../../../explanations/understanding-ebpf.md).
??? abstract "Prerequisites"
- [X] Install fault with Stealth mode support
If you haven’t installed fault yet, follow the
[installation instructions](../../install.md#stealth-feature).
## Capture HTTPS Traffic
- [X] Start the proxy in stealth mode with a normal distribution latency
```bash
fault run \
--stealth \ # (1)!
--capture-process curl \ # (2)!
--with-latency \ # (3)!
--latency-mean 300 \
--latency-stddev 40
```
1. Enable stealth mode
2. Stealth mode will focus only on processes named `curl`
3. Enable the latency fault support
- [X] Send traffic
```bash
curl \
-4 \ # (1)!
-I \ # (2)!
-o /dev/null -s \ # (3)!
-w "Connected IP: %{remote_ip}\nTotal time: %{time_total}s\n" \ # (4)!
https://www.google.com
```
1. fault can only intercept IPv4 traffic
2. Let's only focus on a HEAD request for brevety
3. Discard any returned output
4. Display statistics about the call
## Apply Latency to a PostgreSQL Connection
- [X] Install fault's ebpf dependencies
Follow the procedure to
[install](../../install.md#stealth-feature) the
eBPF programs on your machine.
- [X] Start a local PostgreSQL server using a container
```bash
docker run \
--name demo-db \ # (1)!
-e POSTGRES_USER=demo \ # (2)!
-e POSTGRES_PASSWORD=demo \ # (3)!
-e POSTGRES_DB=demo \ # (4)!
--rm -it \ # (5)!
-p 5432:5432 \ # (6)!
postgres
```
1. Name of the container, useful to identify and delete it later on
2. Default basic user named {{==demo==}}
3. Password set to {{==demo==}} for the user {{==demo==}}
4. Default database name
5. Release all resources once we stop the container
6. Expose the database port onto the host
- [X] Start the proxy in stealth mode with a normal distribution latency
```bash
fault run \
--stealth \ # (1)!
--capture-process curl \ # (2)!
--with-latency \ # (3)!
--latency-mean 300 \
--latency-stddev 40
```
1. Enable stealth mode
2. Stealth mode will focus only on processes named `curl`
3. Enable the latency fault support
- [X] Communicate with your PostgreSQL server
First, install `uv` to run the demonstration script below. Follow the
instructions from the
[uv documentation](https://docs.astral.sh/uv/getting-started/installation/).
Let's use the following basic Python script:
```python title="connect-to-pgsql.py"
import time
import psycopg
def query_database_server_time(url: str) -> None:
start = time.time()
with psycopg.Connection.connect(url) as conn: # (1)!
cur = conn.execute("select now()")
print(cur.fetchone()[0])
print(f"Time taken {time.time() - start}")
if __name__ == "__main__":
connection_url = "postgresql://demo:demo@localhost:5432/demo" # (2)!
query_database_server_time(connection_url)
```
1. We are using a context manager which closes the connection automatically
2. This should reflect the address of your PostgreSQL database
Run the script using `uv`.
```bash
uv run \ # (1)!
--with psycopg[binary] \ # (2)!
python connect-to-pgsql.py
```
1. Use {==uv==} to run the script with the required dependency
2. Install the required dependency on the fly. Here the {==psycopg==} driver
This should output something such as:
```bash
2025-03-08 13:06:16.968350+00:00
Time taken 0.30957818031311035 # (1)!
```
1. This shows the impact of the latency injected by fault into the exchange
!!! info
We use `uv` to ease the management of the Python environment for this
particular script. When we run the script this way, the actual process
executing the script is indeed `python`. This is why fault captures
the network traffic from the `python` process, not from `uv`.
# Configure the TUI
fault is a CLI. But it doesn't mean it shouldn't display the information with
a beautiful TUI (Terminal User Interface).
## Default TUI
The default TUI mode shows a summary of the configuration you set for the proxy
and a summary of the events it sees:
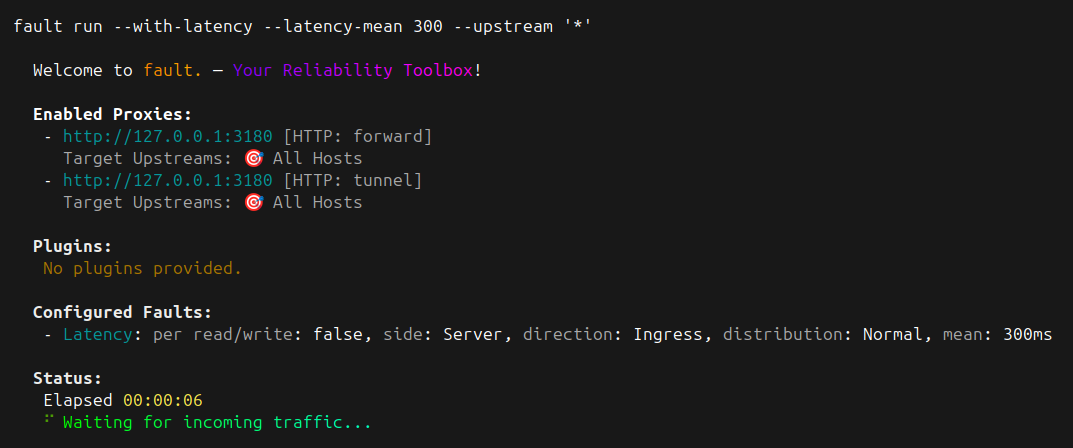 A more comprehensive example:
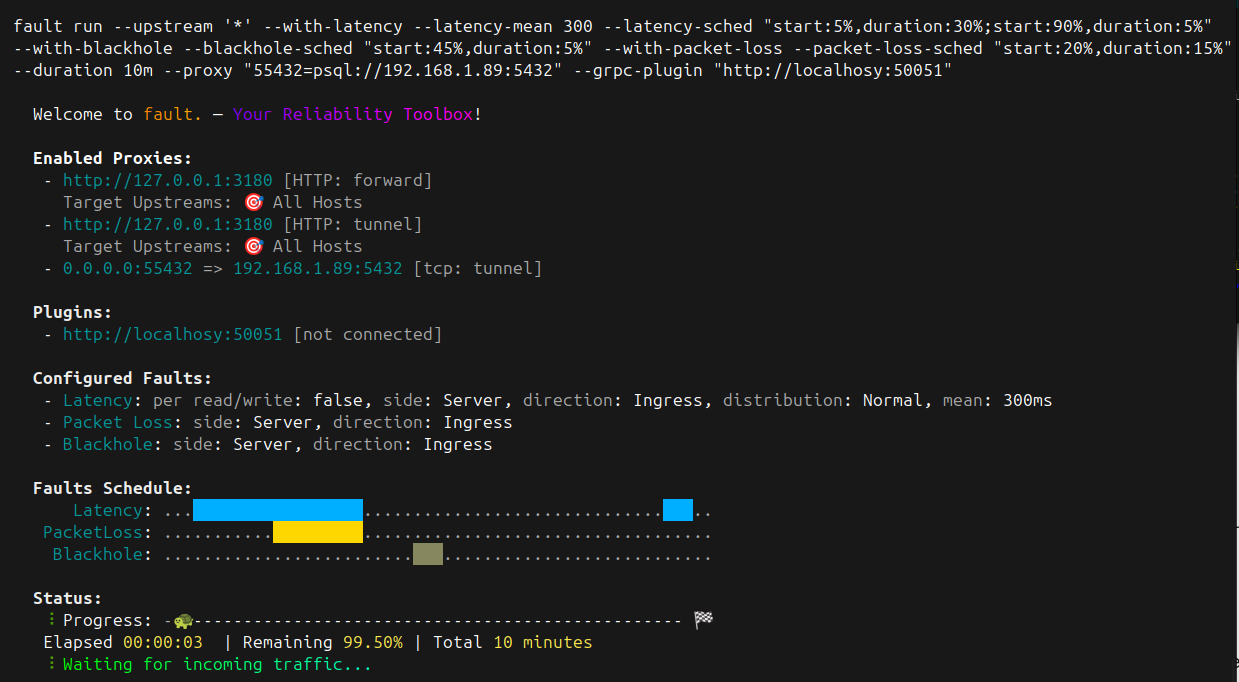 ## Disable the TUI
Sometimes the verbosity of fault is not acceptable or useful. In that case,
you can entirely hide it with the `--no-ui` flag.
## Tailing
The default behavior of the UI is to show a summary of events (traffic and
fault injection) in a very concise manner.
You may switch to a more verbose output by tailing the events using the
`--tail` flag.
## Disable the TUI
Sometimes the verbosity of fault is not acceptable or useful. In that case,
you can entirely hide it with the `--no-ui` flag.
## Tailing
The default behavior of the UI is to show a summary of events (traffic and
fault injection) in a very concise manner.
You may switch to a more verbose output by tailing the events using the
`--tail` flag.
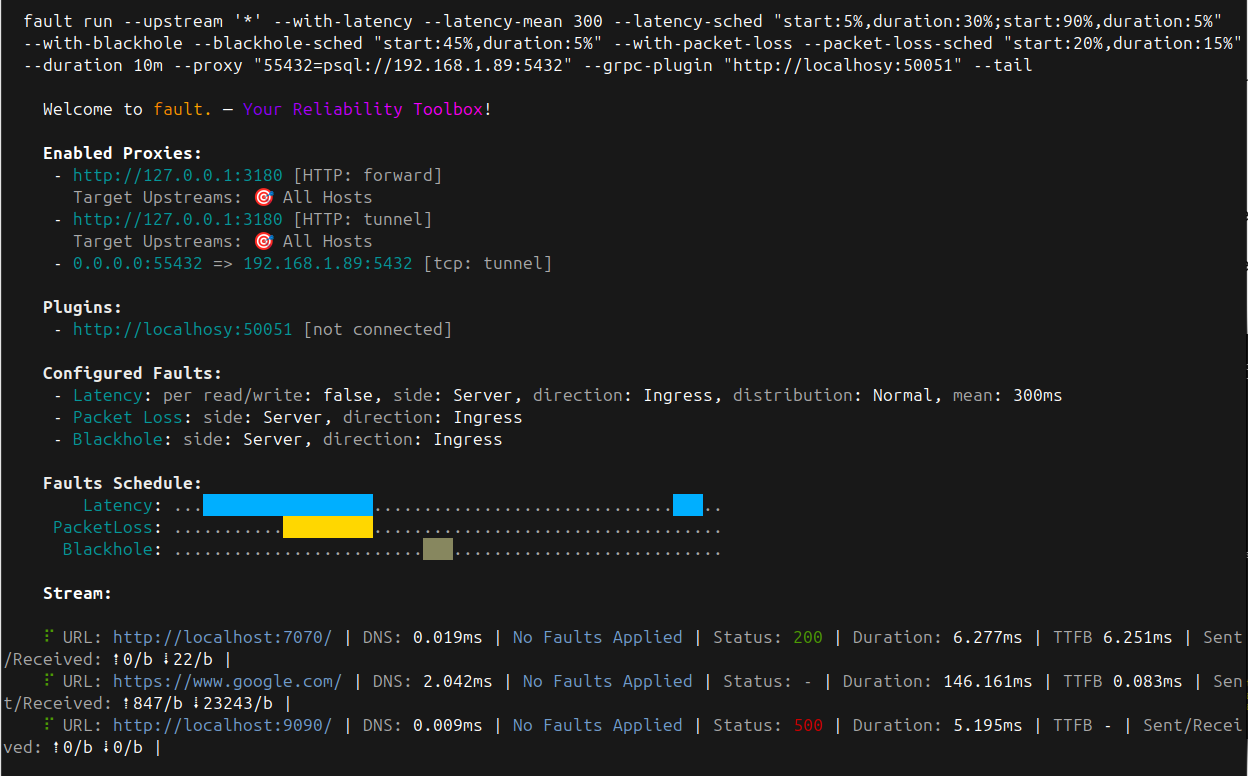 # Run fault as a Chaos Toolkit Action
This guide will walk you through running fault as a [Chaos Toolkit][ctk] action
in your Chaos Engineering experiments.
[ctk]: https://chaostoolkit.org/
[exp]: https://chaostoolkit.org/reference/api/experiment/
[pypa]: https://packaging.python.org/en/latest/tutorials/installing-packages/
[ctkfault]: https://github.com/chaostoolkit-incubator/chaostoolkit-fault
??? abstract "Prerequisites"
- [X] Install fault
If you haven’t installed fault yet, follow the
[installation instructions](../../install.md).
- [X] Install Chaos Toolkit
If you haven’t installed Chaos Toolkit yet, follow the
[installation instructions](https://chaostoolkit.org/reference/usage/install/).
## Run with the Chaos Toolkit fault Extension
- [X] Install the {==chaostoolkit-fault==} extension
??? note
Chaos Toolkit extensions are Python libraries that must be found by the
`chaos` process when it runs. Usually, this requires you install these
extensions as part of your [Python environment][pypa]. There are many
ways to get a Python environment, so we'll assume you are running one.
Install the [chaostoolkit-fault][ctkfault] extension:
=== "pip"
```bash
pip install chaostoolkit-fault
```
=== "uv"
```bash
uv tool install chaostoolkit-fault
```
- [X] Add an action to run the proxy
You can now add the following to one of your experiment:
=== "json"
```json
{
"type": "action",
"name": "run fault proxy with a normal distribution latency",
"provider": {
"type": "python",
"module": "chaosfault.actions",
"func": "run_proxy",
"arguments": {
"proxy_args": "--with-latency --latency-mean 300 --latency-stddev 50 --upstream '*'"
}
},
"background": true
}
```
=== "yaml"
```yaml
---
type: action
name: run fault proxy with a normal distribution latency
provider:
type: python
module: chaosfault.actions
func: run_proxy
arguments:
proxy_args: "--with-latency --latency-mean 300 --latency-stddev 50 --upstream '*'"
background: true
```
You mostly likely want to run the proxy as a background task of the
experiment.
The `proxy_args` argument takes the full list of supported values from the
[cli run command](../reference/cli-commands.md#run-command-options)
- [X] Add an action to stop the proxy
You can now add the following action once your experiment is done with
the proxy.
=== "json"
```json
{
"type": "action",
"name": "stop latency proxy injector",
"provider": {
"type": "python",
"module": "chaosfault.actions",
"func": "stop_proxy"
}
}
```
=== "yaml"
```yaml
---
type: action
name: stop latency proxy injector
provider:
type: python
module: chaosfault.actions
func: stop_proxy
```
!!! tip
You can do without this action if you set the `duration` argument when
you start the proxy. In which case, the proxy will terminate on its
own after the duration is up.
## Next Steps
- Explore how you can use the [Reliably Platform](run-with-reliably.md) to
orchestrate and schedule your experiment on a variety of targets.
# Run fault as a Reliably Plan
This guide will walk you through running fault as part of a
[Reliably Plan][reliably].
[reliably]: https://reliably.com
??? abstract "Prerequisites"
This guide assumes you have an account on a Reliably platform instance.
## Run as part of a Reliably Plan
- [X] Create the Reliably Experiment
To create the Experiment, go to the {==Builder==} page. Look for the
{==Rebound fault==} target and select the {==Run Network Fault Proxy==}
action.
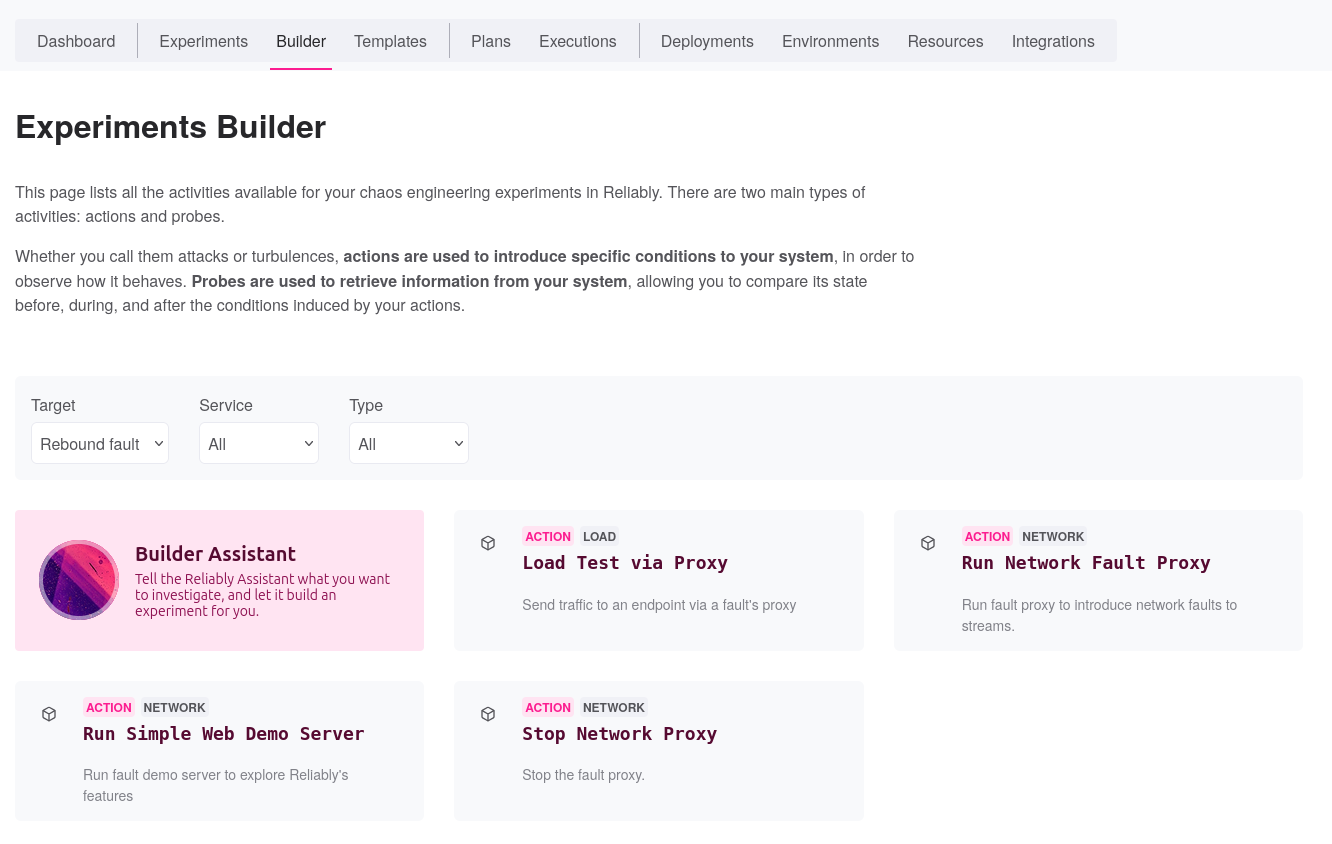
Once select, a new page opens and allows you to fill the details of your
experiment.
* Set a meaninful title and description
* Set tags that will allow members to filter experiments
* Set contributions which define the dimensions impacted by the experiment
Next, fill the experiment's activities:
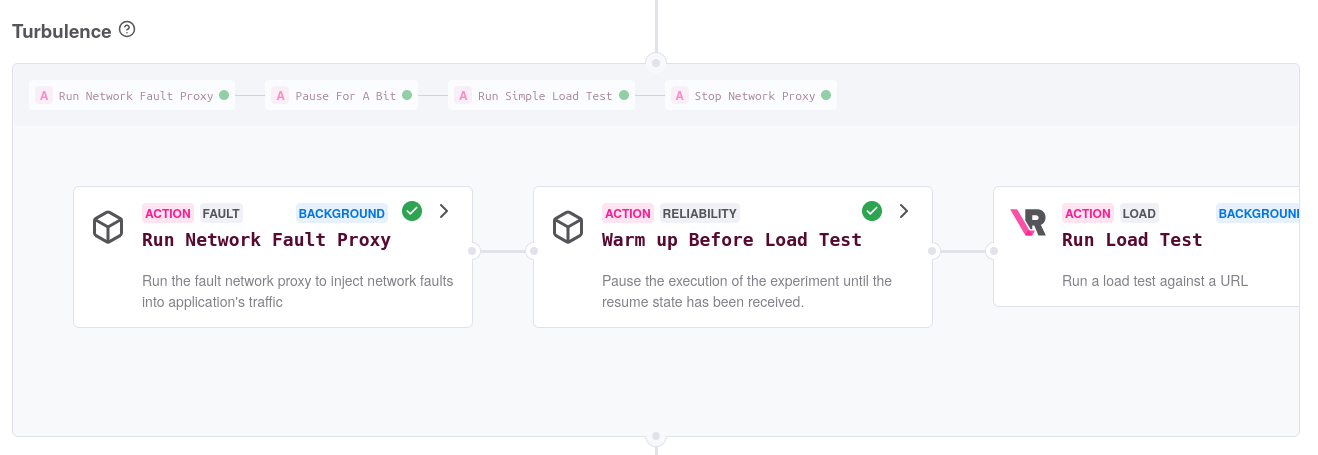
Pass the [proxy CLI arguments](../reference/cli-commands.md#run-command-options)
as you would to the `fault run` command itself. For instance, let's use the
following argument line:
```bash
--duration 45s \
--with-latency \ # (1)!
--latency-mean 300 \ # (2)!
--latency-sched "duration:10s;start:25s,duration:17s" # (3)!
```
1. Run `fault` with a `latency` fault
2. Inject a `300ms` delay on responses
3. Inject the fault only for around `60%` of the total duration of the run
We suggest you run the action in background so that other activities can
take place while it is running.
Finally, if you did not set the `--duration` flag, you want to keep the
{==Stop Network Proxy==} action so that your proxy is properly terminated.
In such case, remember you can only set
[fixed schedules](../how-to/proxy/lifecycle.md#scheduling).
At that stage you may want to insert new activities once the proxy has
started by clicking the little `+` icon on the right of the
{==Run Network Fault Proxy==} activity.
For instance, you could run a basic load test and send its traffic via
the proxy. Choose the {==Run Simple Load Test==} action from the Reliably
target provider. Fill the target URL and, at the bottom of the action,
set the proxy url to `http://localhost:3180` which is the proxy's address.
Save now the experiment which redirects you to its page.
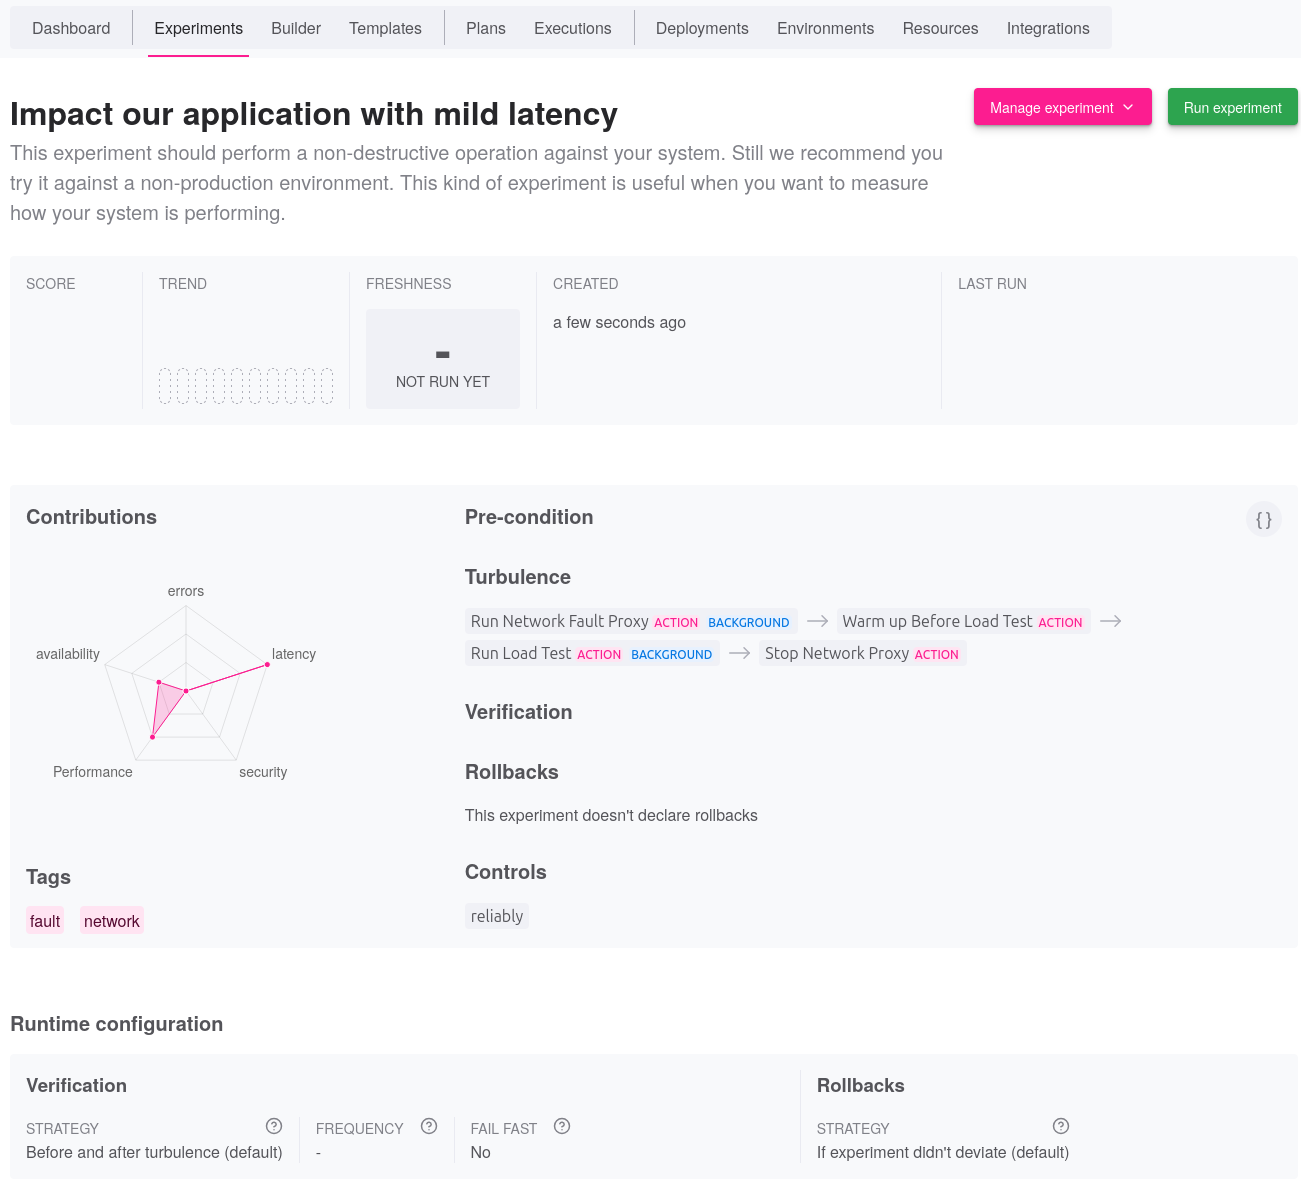
- [X] Schedule the Reliably Plan
Click now on the {==Run experiment==} button which leads you to the
Reliably Plan form.
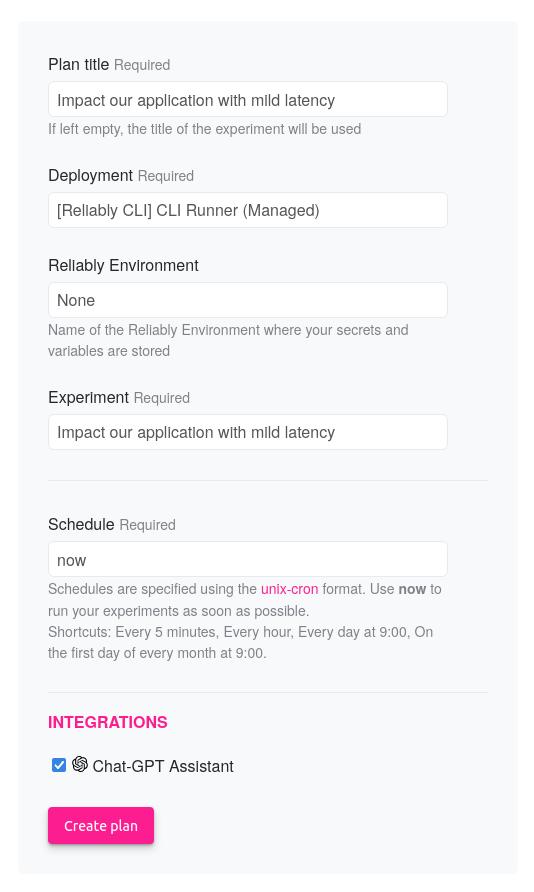
Select now the appropriate deployment to run the experiment. If, you need
to pass specific Environment variables, you may set the {==Environment==}
as well.
On this example, we also enable the {==Open AI==} extension which will
send the experiment's questions to [OpenAI](https://platform.openai.com)
while the plan runs.
!!! info
No other information is ever sent to OpenAI.
The plan will then be scheduled to start immediately.
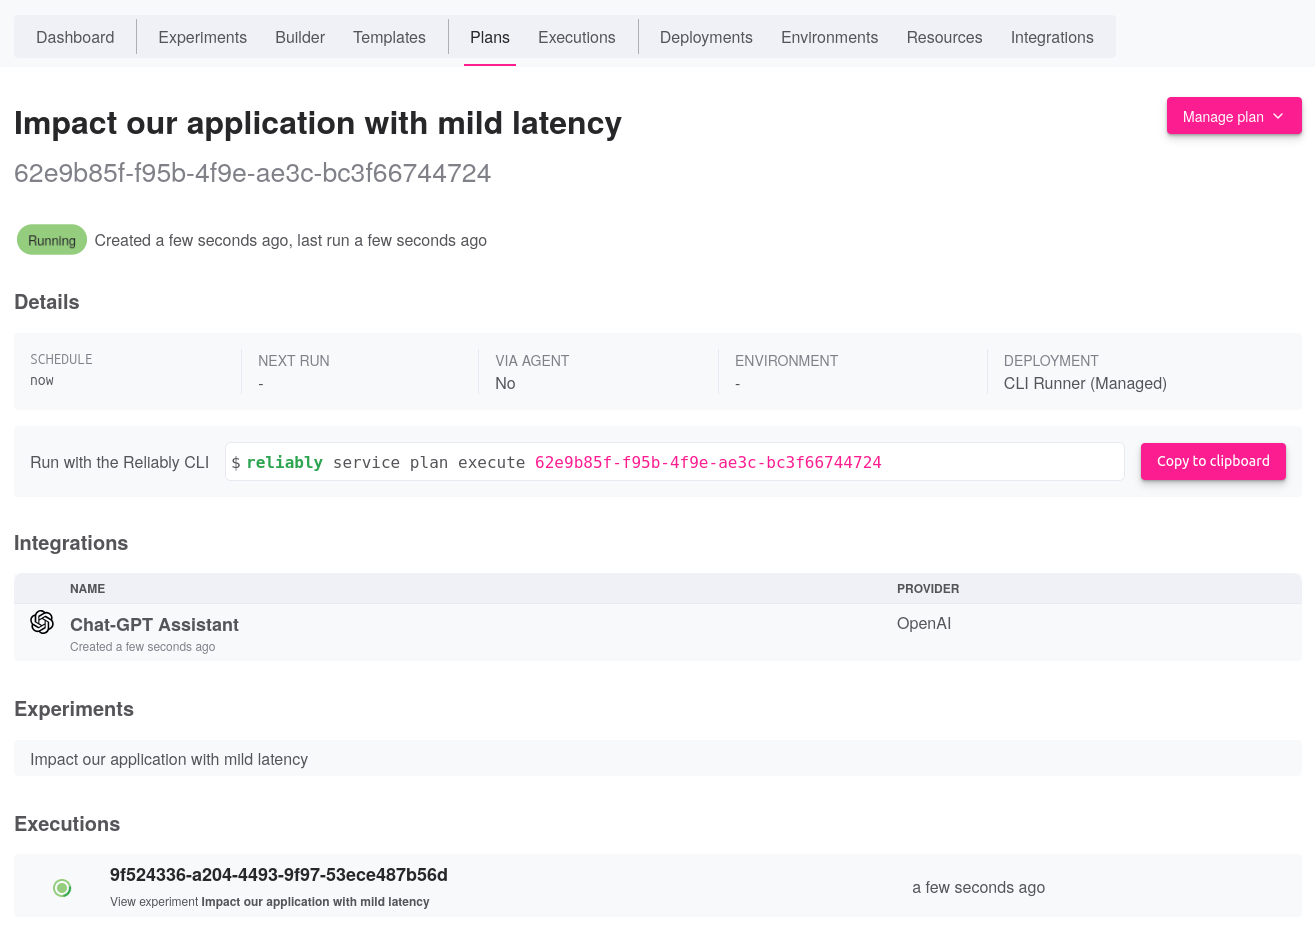
- [X] Review the Reliably Execution
Once the plan has completed, you may review its execution. Below is the
timeline of this execution:
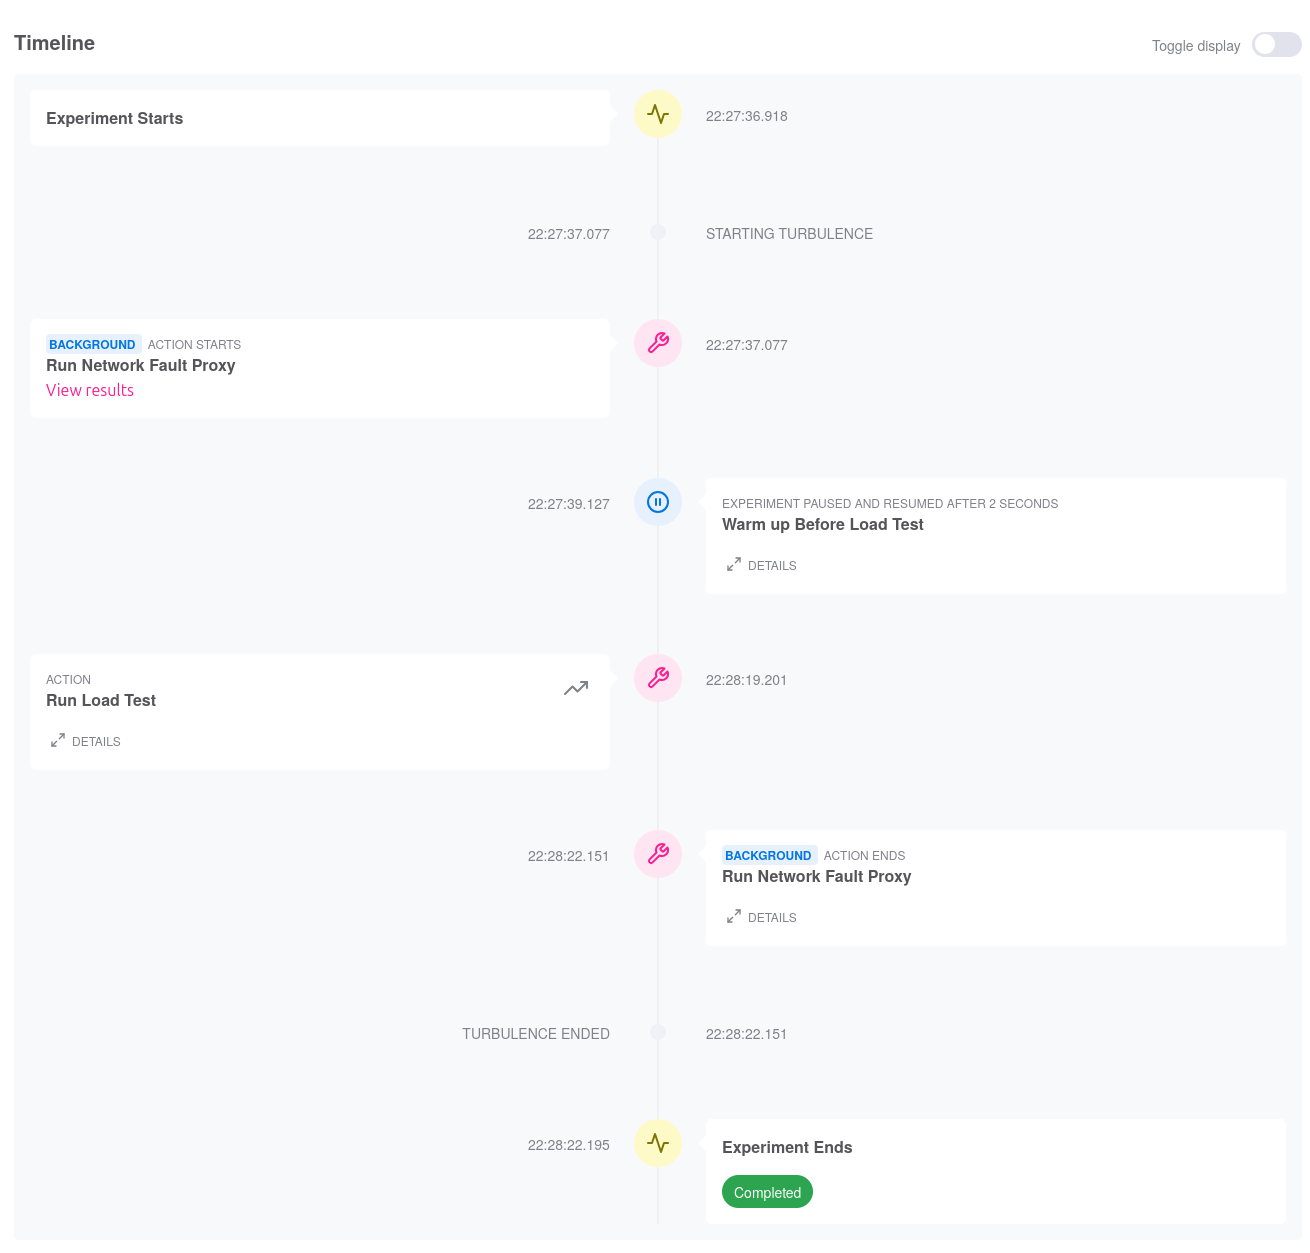
Zooming into the {==Run Simple Load Test==} step, we can indeed see how
around 60% of the requests were impacted by our latency.
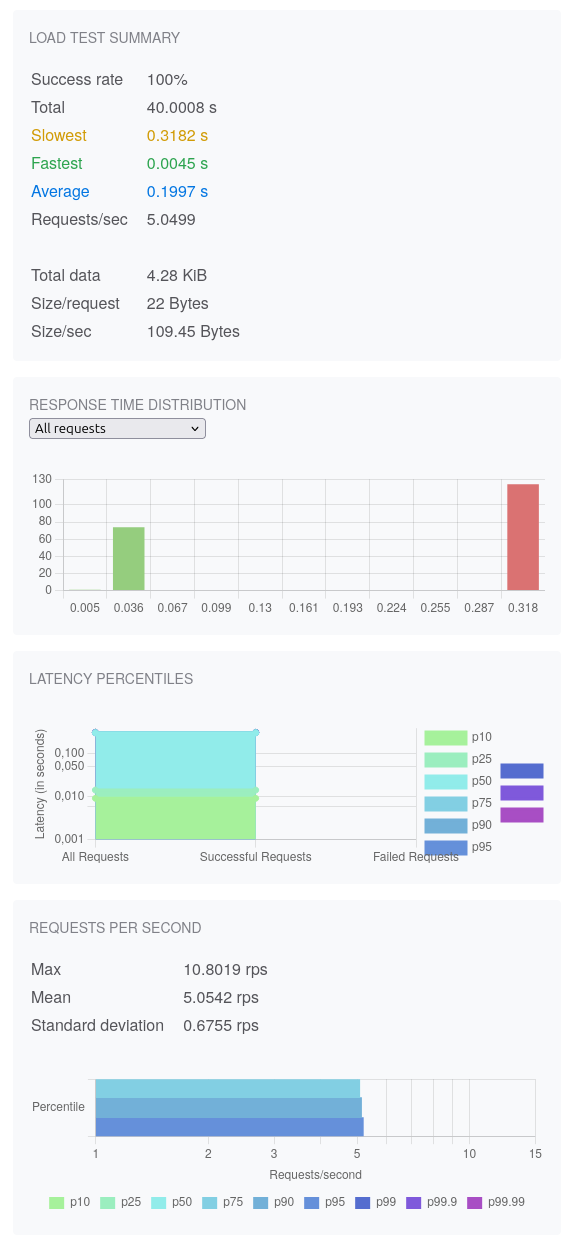
As a bonus point, we can also see that our questions to OpenAI were keenly
answered:
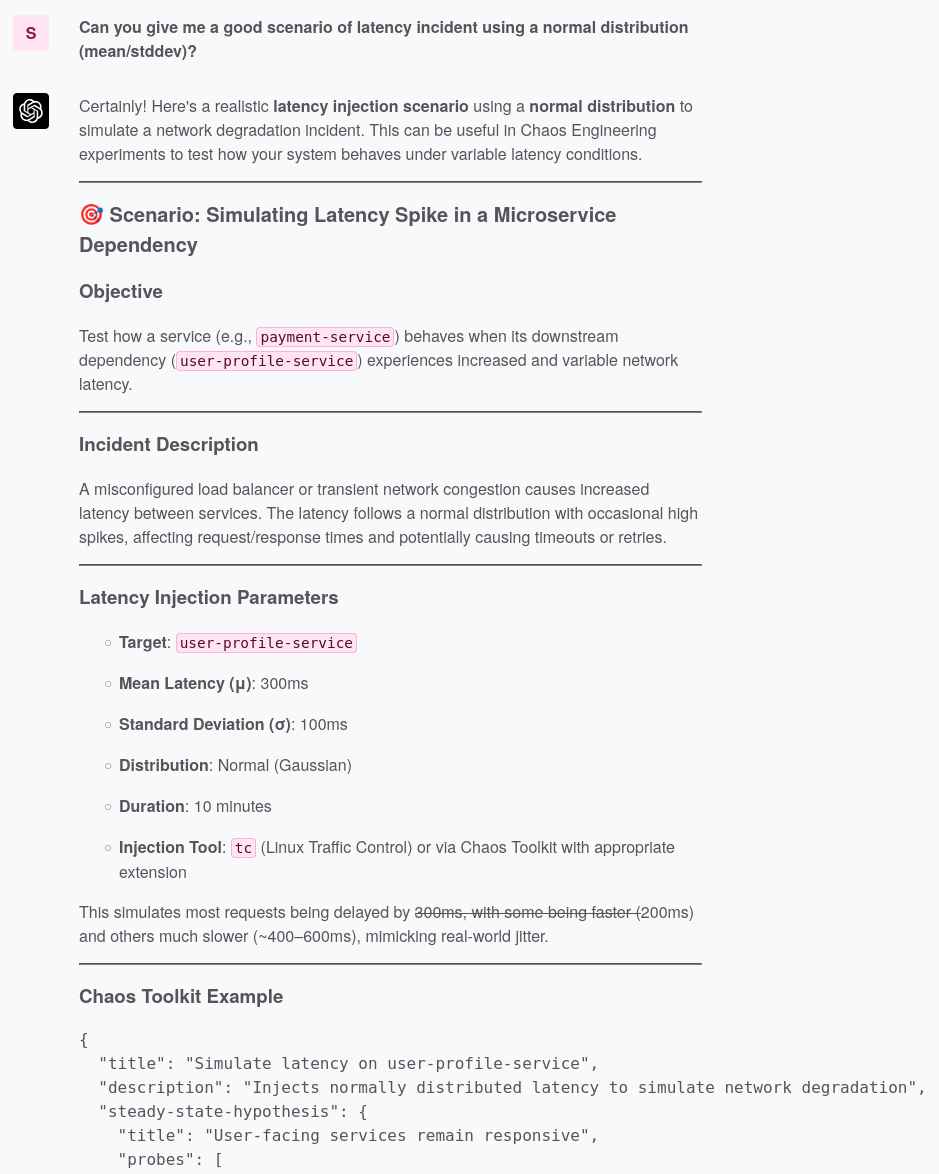
The assistant exposes the theory behind exploring latency and moves on
to show us a Chaos Toolkit experiment. Remember that a Chaos Toolkit
experiment can be imported and used as a Reliably Experiment.
!!! warning "Critical thinking remains your best strategy"
LLM models are known to hallucinate at times. More than often, the LLM
will suggest Chaos Toolkit activities that don't exist. Nonetheless,
it's a valuable discussion starting point.
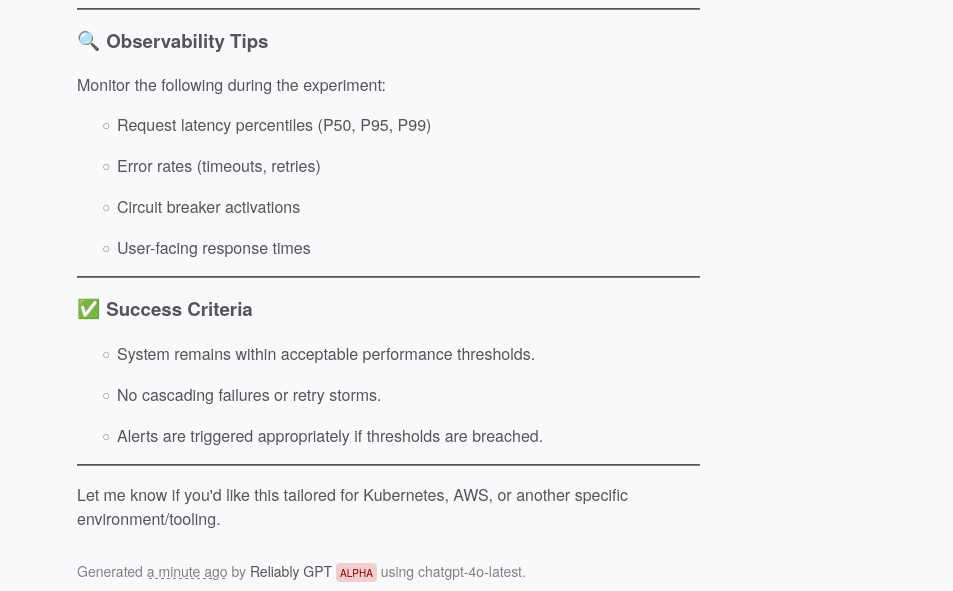
The assistant expands on its reply with more useful context about what to
look for as your run such an experiment.
Overall, the assistant is here to support your own analysis and you should
use it as a data point only, not as the one truth.
Finally, the assistant also responds to the question about well-known
incidents, which may help put your experiment into context:
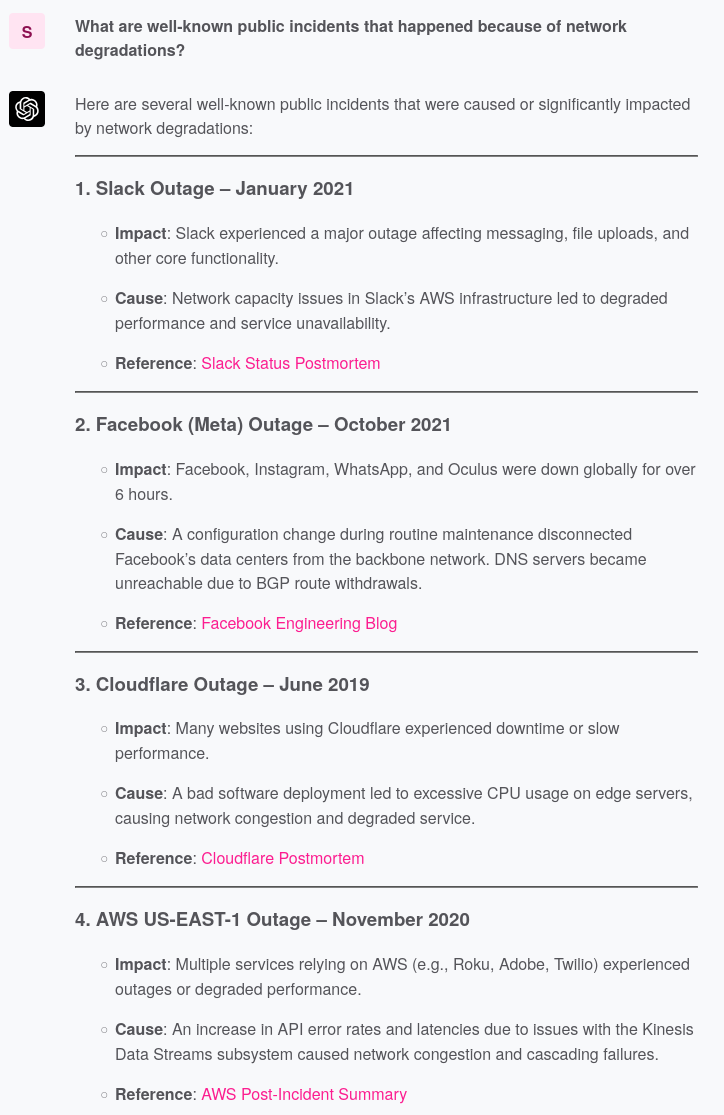
## Next Steps
- **Explore [Reliably](https://reliably.com)** to understand how you can run
a plan on various deployment targets.
# Generate Automated Resilience Testing Scenarios
This guide will walk you through generating fault resilience scenarios that you
can run automatically to validate the capability of your endpoints to deal
with network issues.
!!! abstract "Prerequisites"
- [X] Install fault
If you haven’t installed fault yet, follow the
[installation instructions](../install.md).
- [X] Scenario Reference
You might want to familiar yourself with the
[scenario reference](../../reference/scenario-file-format.md).
## Create Single Shot Scenarios
In this guide, we will demonstrate how to create a single scenario against the
fault demo application. Single call scenarios make only one request to the
target endpoint.
- [X] Start demo application provided by fault
```bash
fault demo run
```
- [X] Create the scenario file
The following scenario runs a single HTTP request against the
`/ping` endpoint of the demo application. That endpoint in turns make
a request to `https://postman-echo.com` which is the call our scenario
will impact with a light latency.
```yaml title="scenario.yaml"
--- # (1)!
title: "Add 80ms latency to ingress from the remote service and expects we verify our expectations"
description: "Our endpoint makes a remote call which may not respond appropriately, we need to decide how this impacts our own users"
items: # (2)!
- call:
method: GET
url: http://localhost:7070/ping
context:
upstreams:
- https://postman-echo.com # (3)!
faults: # (4)!
- type: latency
mean: 80
stddev: 5
expect:
status: 200 # (5)!
response_time_under: 500 # (6)!
```
1. A scenario file may have as many scenarios as you want
2. You may group several calls, and their own context, per scenario
3. This is the host impacted by the latency
4. You may apply multiple faults at the same time
5. We do not tolerate the call to fail
6. We expect to respond globally under `500ms`
## Create Repeated Call Scenarios
In this guide, we will demonstrate how to create a repeated scenario against the
fault demo application. Repated call scenarios make a determinitic number of
requests to the target endpoint, with the possibility to increase some of the
fault parameters by a step on each iteration.
- [X] Start demo application provided by fault
```bash
fault demo run
```
- [X] Create the scenario file
The following scenario runs several HTTP requests against the
`/ping` endpoint of the demo application. That endpoint in turns make
a request to `https://postman-echo.com` which is the call our scenario
will impact with a light latency.
```yaml title="scenario.yaml"
--- # (1)!
title: "Start with 80ms latency and increase it by 30ms to ingress from the remote service and expects we verify our expectations"
description: "Our endpoint makes a remote call which may not respond appropriately, we need to decide how this impacts our own users"
items: # (2)!
- call:
method: GET
url: http://localhost:7070/ping
context:
upstreams:
- https://postman-echo.com # (3)!
strategy: # (4)!
mode: repeat
step: 30 # (5)!
count: 3 # (6)!
add_baseline_call: true # (7)!
faults: # (8)!
- type: latency
mean: 80
stddev: 5
expect:
status: 200 # (9)!
response_time_under: 500 # (10)!
```
1. A scenario file may have as many scenarios as you want
2. You may group several calls, and their own context, per scenario
3. This is the host impacted by the latency
4. The `strategy` block defines how fault should run this scenario's call
5. The step by which we increase latency on each iteration
6. How many iterations we iterate
7. Do we have a baseline call, without fault, at the start?
8. You may apply multiple faults at the same time
9. We do not tolerate the call to fail
10. We expect to respond globally under `500ms`
## Create Load Test Call Scenarios
In this guide, we will demonstrate how to create a load test scenario against
the fault demo application. Load test call scenarios make a number of
requests to the target endpoint over a duration.
!!! warning
fault is not a full-blown load testing tool. It doesn't aim at becoming
one. The facility provided by this strategy is merely a convenience for
very small load tests. It can prove very useful nonetheless.
- [X] Start demo application provided by fault
```bash
fault demo run
```
- [X] Create the scenario file
The following scenario runs several HTTP requests against the
`/` endpoint of the demo application.
```yaml title="scenario.yaml"
--- # (1)!
title: "Sustained latency with a short loss of network traffic"
description: "Over a period of 10s, inject a 90ms latency. After 3s and for a period of 2s also send traffic to nowhere."
items: # (2)!
- call:
method: GET
url: http://localhost:7070/
context:
upstreams:
- http://localhost:7070 # (3)!
strategy: # (4)!
mode: load
duration: 10s # (5)!
clients: 3 # (6)!
rps: 2 # (7)!
faults:
- type: latency
global: false # (8)!
mean: 90
- type: blackhole
period: "start:30%,duration:20%" # (9)!
slo: # (10)!
- type: latency
title: "P95 Latency < 110ms"
objective: 95
threshold: 110.0
- type: latency
title: "P99 Latency < 200ms"
objective: 99
threshold: 200.0
- type: error
title: "P98 Error Rate < 1%"
objective: 98
threshold: 1
```
1. A scenario file may have as many scenarios as you want
2. You may group several calls, and their own context, per scenario
3. This is the host impacted by the latency
4. The `strategy` block defines how fault should run this scenario's call
5. The total duration of our test. We support the following [units](https://docs.rs/parse_duration/latest/parse_duration/#units)
6. The number of connected clients
7. The number of request per second per client
8. Inject latency for each read/write operation, not just once
9. Schedule the blackhole fault for a period of the total duration only
10. Rather thana single status code and latency, we evaluate SLO against the load results
The load strategy is powerful because it allows you to explore the
application's behavior over a period of time while keeping a similar
approach to other strategies.
Notably, you should remark how we can apply the faults with a schedule
so you can see how they impact the application when they come and go. You
should also note the use of SLO to review the results in light of service
expectations over period of times.
Please read more about these capabilities in the
[scenario reference](../../reference/scenario-file-format.md).
## Generate Scenarios from an OpenAPI Specification
This guide shows you can swiftly generate common basic scenarios for a large
quantity of endpoints discovered from an OpenAPI specification.
!!! info
fault can generate scenarios from OpenAPI
[v3.0.x](https://spec.openapis.org/oas/v3.0.3.html) and
[v3.1.x](https://spec.openapis.org/oas/v3.1.1.html).
- [X] Generate from a specification file
```bash
fault scenario generate --scenario scenario.yaml --spec-file openapi.yaml
```
- [X] Generate from a specification URL
```bash
fault scenario generate --scenario scenario.yaml --spec-url http://myhost/openapi.json
```
- [X] Generate one scenario file per endpoint
```bash
fault scenario generate \
--scenario scenarios/ \ # (1)!
--spec-url http://myhost/openapi.json
Generated 24 reliability scenarios across 3 endpoints!
```
1. Pass a directory where the files will be stored
This approach is nice to quickly generate scenarios but if your specification
is large, you will endup with hundreds of them. Indeed, fault will create
tests for single shot, repeated calls or load tests. All of these with a
combination of faults.
We suggest you trim down only to what you really want to explore. Moreover,
you will need to edit the scenarios for placeholders and other headers
needed to make the calls.
Below is an example of a generated scenarios against the
[Reliably platform](https://reliably.com):
```yaml
title: Single high-latency spike (client ingress)
description: A single 800ms spike simulates jitter buffer underrun / GC pause on client network stack.
items:
- call:
method: GET
url: http://localhost:8090/api/v1/organization/{org_id}/experiments/all
meta:
operation_id: all_experiments_api_v1_organization__org_id__experiments_all_get
context:
upstreams:
- http://localhost:8090/api/v1/organization/{org_id}/experiments/all
faults:
- type: latency
side: client
mean: 800.0
stddev: 100.0
direction: ingress
strategy: null
expect:
status: 200
```
!!! abstract "Read more about scenarios..."
[Learn more](../../reference/scenario-file-format.md) about scenarios and
explore their capabilities.
## Pass Headers to the Scenario
In this guide, you will learn how to provide HTTP headers to the request made
for a scenario.
- [X] Start demo application provided by fault
```bash
fault demo run
```
- [X] Create the scenario file
The following scenario runs a single HTTP request against the
`/ping` endpoint of the demo application. That endpoint in turns make
a request to `https://postman-echo.com` which is the call our scenario
will impact with a light latency.
```yaml title="scenario.yaml"
---
title: "Add 80ms latency to ingress from the remote service and expects we verify our expectations"
description: "Our endpoint makes a remote call which may not respond appropriately, we need to decide how this impacts our own users"
items:
- call:
method: GET
url: http://localhost:7070/ping
headers:
Authorization: bearer token # (1)!
context:
upstreams:
- https://postman-echo.com
faults:
- type: latency
mean: 80
stddev: 5
expect:
status: 200
response_time_under: 500
```
1. Pass headers as a mapping of `key: value` pairs. Note in the particular
case of the `Authorization` header, its value will not be shown as par
of the report but replaced by a placeholder opaque string.
## Make Requests With a Body
In this guide, you will learn how to pass a body string to the request.
- [X] Start demo application provided by fault
```bash
fault demo run
```
- [X] Create the scenario file
The following scenario runs a single HTTP request against the
`/ping` endpoint of the demo application. That endpoint in turns make
a request to `https://postman-echo.com` which is the call our scenario
will impact with a light latency.
```yaml title="scenario.yaml"
---
title: "Add 80ms latency to ingress from the remote service and expects we verify our expectations"
description: "Our endpoint makes a remote call which may not respond appropriately, we need to decide how this impacts our own users"
items:
- call:
method: POST # (1)!
url: http://localhost:7070/ping
headers:
Content-Type: application/json # (2)!
body: '{"message": "hello there"}' # (3)!
context:
upstreams:
- https://postman-echo.com
faults:
- type: latency
mean: 80
stddev: 5
expect:
status: 200
response_time_under: 500
```
1. Set the method to `POST`
2. Pass the actual body content-type.
3. Pass the body as an encoded string
## Bring on your SRE hat
When running scenarios with a {==load==} or {==repeat==} strategy, we encourage
you to bring SLO into their context. They will give you invaluable insights
about the expectations that could be broken due to a typical faults combination.
```yaml
slo:
- type: latency
title: "P95 Latency < 110ms"
objective: 95
threshold: 110.0
- type: latency
title: "P99 Latency < 200ms"
objective: 99
threshold: 200.0
- type: error
title: "P98 Error Rate < 1%"
objective: 98
threshold: 1
```
fault supports two types of SLO: `latency` and `error`. When a scenario is
executed, the generated report contains an analysis of the results of the run
against these objectives. It will decide if broke them or not based on the
volume of traffic and duration of the scenario.
## Next Steps
- **Learn how to [run](./run.md)** these scenarios.
- **Explore the [specification reference](../../reference/scenario-file-format.md)**
for scenarios.
# Explore Scenario Reports
In this guide, you will learn how to interpret the reports generated from
running scenarios.
??? abstract "Prerequisites"
- [X] Install fault
If you haven’t installed fault yet, follow the
[installation instructions](../install.md).
- [X] Generate Scenario Files
If you haven’t created a scenario file, please read this
[guide](./generate.md).
- [X] Run Scenario Files
If you haven’t executed scenario files, please read this
[guide](./run.md).
## Results vs Report
faulfaultt generates two assets when running scenarios:
* `results.json` an extensive account of what happened during the run, including
a detailed trace of all the faults that were injected
* `report.md` a markdown high-level report from a run
## Report Example
Below is an example of a generated markdown report.
---
## Scenarios Report
Start: 2025-05-05 11:20:12.665603456 UTC
End: 2025-05-05 11:20:37.004974829 UTC
### Scenario: Latency Increase By 30ms Steps From Downstream (items: 6)
#### 🎯 `GET` http://localhost:7070/ping | Passed
**Call**:
- Method: `GET`
- Timeout: -
- Headers: -
- Body?: No
**Strategy**: single shot
**Faults Applied**:
- Latency: ➡️🖧, Per Read/Write Op.: false, Mean: 80.00 ms, Stddev: 5.00 ms
**Expectation**: Response time Under 490ms | Status Code 200
**Run Overview**:
| Num. Requests | Num. Errors | Min. Response Time | Max Response Time | Mean Latency (ms) | Expectation Failures | Total Time |
|-----------|---------|--------------------|-------------------|-------------------|----------------------|------------|
| 1 | 0 (0.0%) | 457.66 | 457.66 | 457.66 | 0 | 464 ms |
| Latency Percentile | Latency (ms) | Num. Requests (% of total) |
|------------|--------------|-----------|
| p25 | 457.66 | 1 (100.0%) |
| p50 | 457.66 | 1 (100.0%) |
| p75 | 457.66 | 1 (100.0%) |
| p95 | 457.66 | 1 (100.0%) |
| p99 | 457.66 | 1 (100.0%) |
#### 🎯 `GET` http://localhost:7070/ping | Failed
**Call**:
- Method: `GET`
- Timeout: -
- Headers: -
- Body?: No
**Strategy**: repeat 3 times with a step of 30
**Faults Applied**:
- Latency: ➡️🖧, Per Read/Write Op.: false, Mean: 80.00 ms, Stddev: 5.00 ms
**Expectation**: Response time Under 390ms | Status Code 200
**Run Overview**:
| Num. Requests | Num. Errors | Min. Response Time | Max Response Time | Mean Latency (ms) | Expectation Failures | Total Time |
|-----------|---------|--------------------|-------------------|-------------------|----------------------|------------|
| 4 | 0 (0.0%) | 365.09 | 838.84 | 373.65 | 1 | 1 second and 968 ms |
| Latency Percentile | Latency (ms) | Num. Requests (% of total) |
|------------|--------------|-----------|
| p25 | 365.99 | 2 (50.0%) |
| p50 | 373.65 | 3 (75.0%) |
| p75 | 723.78 | 4 (100.0%) |
| p95 | 838.84 | 4 (100.0%) |
| p99 | 838.84 | 4 (100.0%) |
| SLO | Pass? | Objective | Margin | Num. Requests Over Threshold (% of total) |
|-----------|-------|-----------|--------|--------------------------|
| P95 < 300ms | ❌ | 95% < 300ms | Above by 538.8ms | 4 (100.0%) |
#### 🎯 `GET` http://localhost:7070/ | Passed
**Call**:
- Method: `GET`
- Timeout: 500ms
- Headers:
- Authorization: xxxxxx
- X-Whatever: blah
- Body?: No
**Strategy**: load for 10s with 5 clients @ 20 RPS
**Faults Applied**:
| Type | Timeline | Description |
|------|----------|-------------|
| latency | 0% `xxxxxxxxxx` 100% | Latency: ➡️🖧, Per Read/Write Op.: true, Mean: 90.00 ms |
| blackhole | 0% `.xx.......` 100% | Blackhole: ➡️🖧 |
**Run Overview**:
| Num. Requests | Num. Errors | Min. Response Time | Max Response Time | Mean Latency (ms) | Expectation Failures | Total Time |
|-----------|---------|--------------------|-------------------|-------------------|----------------------|------------|
| 396 | 30 (7.6%) | 32.89 | 504.95 | 93.19 | 0 | 10 seconds and 179 ms |
| Latency Percentile | Latency (ms) | Num. Requests (% of total) |
|------------|--------------|-----------|
| p25 | 78.47 | 100 (25.3%) |
| p50 | 93.19 | 199 (50.3%) |
| p75 | 108.81 | 298 (75.3%) |
| p95 | 500.94 | 378 (95.5%) |
| p99 | 504.64 | 394 (99.5%) |
| SLO | Pass? | Objective | Margin | Num. Requests Over Threshold (% of total) |
|-----------|-------|-----------|--------|--------------------------|
| P95 Latency < 110ms | ❌ | 95% < 110ms | Above by 390.9ms | 92 (23.2%) |
| P99 Latency < 200ms | ❌ | 99% < 200ms | Above by 304.6ms | 30 (7.6%) |
| P98 Error Rate < 1% | ❌ | 98% < 1% | Above by 6.6 | 30 (7.6%) |
---
### Scenario: Single high latency spike (items: 1)
_Description:_ Evaluate how we tolerate one single high latency spike
#### 🎯 `GET` http://localhost:7070/ | Passed
**Call**:
- Method: `GET`
- Timeout: -
- Headers: -
- Body?: No
**Strategy**: single shot
**Faults Applied**:
- Latency: ➡️🖧, Per Read/Write Op.: false, Mean: 800.00 ms, Stddev: 100.00 ms
**Expectation**: Status Code 200
**Run Overview**:
| Num. Requests | Num. Errors | Min. Response Time | Max Response Time | Mean Latency (ms) | Expectation Failures | Total Time |
|-----------|---------|--------------------|-------------------|-------------------|----------------------|------------|
| 1 | 0 (0.0%) | 795.82 | 795.82 | 795.82 | 0 | 800 ms |
| Latency Percentile | Latency (ms) | Num. Requests (% of total) |
|------------|--------------|-----------|
| p25 | 795.82 | 1 (100.0%) |
| p50 | 795.82 | 1 (100.0%) |
| p75 | 795.82 | 1 (100.0%) |
| p95 | 795.82 | 1 (100.0%) |
| p99 | 795.82 | 1 (100.0%) |
---
### Scenario: Gradual moderate latency increase (items: 6)
_Description:_ Evaluate how we tolerate latency incrementally growing
#### 🎯 `GET` http://localhost:7070/ | Passed
**Call**:
- Method: `GET`
- Timeout: -
- Headers: -
- Body?: No
**Strategy**: repeat 5 times with a step of 100
**Faults Applied**:
- Latency: ➡️🖧, Per Read/Write Op.: false, Mean: 100.00 ms, Stddev: 30.00 ms
**Expectation**: Status Code 200
**Run Overview**:
| Num. Requests | Num. Errors | Min. Response Time | Max Response Time | Mean Latency (ms) | Expectation Failures | Total Time |
|-----------|---------|--------------------|-------------------|-------------------|----------------------|------------|
| 6 | 0 (0.0%) | 50.67 | 137.63 | 89.63 | 0 | 566 ms |
| Latency Percentile | Latency (ms) | Num. Requests (% of total) |
|------------|--------------|-----------|
| p25 | 52.03 | 2 (33.3%) |
| p50 | 89.63 | 4 (66.7%) |
| p75 | 123.53 | 6 (100.0%) |
| p95 | 137.63 | 6 (100.0%) |
| p99 | 137.63 | 6 (100.0%) |
---
### Scenario: Repeated mild latencies periods over a 10s stretch (items: 1)
_Description:_ Evaluate how we deal with periods of moderate latencies over a period of time
#### 🎯 `GET` http://localhost:7070/ | Passed
**Call**:
- Method: `GET`
- Timeout: -
- Headers: -
- Body?: No
**Strategy**: load for 10s with 3 clients @ 2 RPS
**Faults Applied**:
| Type | Timeline | Description |
|------|----------|-------------|
| latency | 0% `.xx.......` 100% | Latency: ➡️🖧, Per Read/Write Op.: false, Mean: 150.00 ms |
| latency | 0% `....xx....` 100% | Latency: ➡️🖧, Per Read/Write Op.: false, Mean: 250.00 ms |
| latency | 0% `.......xx.` 100% | Latency: ➡️🖧, Per Read/Write Op.: false, Mean: 150.00 ms |
**Run Overview**:
| Num. Requests | Num. Errors | Min. Response Time | Max Response Time | Mean Latency (ms) | Expectation Failures | Total Time |
|-----------|---------|--------------------|-------------------|-------------------|----------------------|------------|
| 60 | 0 (0.0%) | 0.27 | 616.96 | 524.52 | 0 | 10 seconds and 330 ms |
| Latency Percentile | Latency (ms) | Num. Requests (% of total) |
|------------|--------------|-----------|
| p25 | 401.47 | 16 (26.7%) |
| p50 | 524.52 | 31 (51.7%) |
| p75 | 550.17 | 46 (76.7%) |
| p95 | 596.09 | 58 (96.7%) |
| p99 | 616.96 | 60 (100.0%) |
| SLO | Pass? | Objective | Margin | Num. Requests Over Threshold (% of total) |
|-----------|-------|-----------|--------|--------------------------|
| P95 Latency < 110ms | ❌ | 95% < 110ms | Above by 486.1ms | 54 (90.0%) |
| P99 Latency < 200ms | ❌ | 99% < 200ms | Above by 417.0ms | 54 (90.0%) |
| P98 Error Rate < 1% | ✅ | 98% < 1% | Below by 1.0 | 0 (0.0%) |
---
# Run fault Scenarios
In this guide, you will learn how to run fault scenarios and read the generated
report.
??? abstract "Prerequisites"
- [X] Install fault
If you haven’t installed fault yet, follow the
[installation instructions](../install.md).
- [X] Generate Scenario Files
If you haven’t created a scenario file, please read this
[guide](./generate.md).
## Run a Scenario File
We will explore now how to run scenarios generated to verify the resilience of
the fault demo application itself.
- [X] Start demo application provided by fault
```bash
fault demo run # (1)!
```
1. The application under test must be started for the scenario to be
meaningful. Otherwise, the scenarios will all fail.
- [X] Run a scenario file
```bash
fault scenario run --scenario scenario.yaml
```
## Run Many Scenario Files
We will explore now how to run scenarios generated to verify the resilience of
the fault demo application itself. In this specific use case, we assume you want
to run many scenario files at once and that they are located in the
same directory.
- [X] Start demo application provided by fault
```bash
fault demo run # (1)!
```
1. The application under test must be started for the scenario to be
meaningful. Otherwise, the scenarios will all fail.
- [X] Run scenario files located in a directory
```bash
fault scenario run --scenario scenarios/ # (1)!
```
1. fault will load all YAML files in that directory.
## Run a Scenario on Kubernetes
The default behavior is to execute a scenario locally to where the command
is started. A scenario offers a way to run the proxy [from within a Kubernetes
cluster](../../reference/scenario-file-format.md#running-on-a-platform).
- [X] Configure the scenario to run on a Kubernetes cluster
```yaml
context:
runs_on:
platform: kubernetes
ns: default # (1)!
service: nginx # (2)!
```
1. The namespace of the target service
2. The target service which should be part of the test chain
The scenario will be executed locally but the proxy will be deployed inside
the cluster directly.
## Next Steps
- **Learn how to explore the generated [report](./reporting.md)** from running these scenarios.
- **Explore the [specification reference](../../reference/scenario-file-format.md)**
for scenarios.
#
# Built-in Faults
fault comes with a set of builtin faults. This page explores each fault
and how they get applied.
## Latency
**Definition**
A network fault that delays traffic by a specified amount of time. Latency
commonly contributes to degraded user experience and is often used to simulate
real-world connection slowdowns.
### Key Characteristics
- **Application Side**
The fault can be applied between different segments of a connection:
- Client Side: Limits data moving from the client to the proxy.
- Server Side: Caps data flow from the proxy to the upstream server.
- **Direction**
The fault can be targeted to affect either the inbound traffic (ingress),
outbound traffic (egress), or both, allowing you to simulate delays on one or
both sides of a connection.
- **Timing:**
- **Once per connection**
Useful for request/response communication (e.g., HTTP). Applies a single
delay on the first operation (read or write).
- **Per-operation**
For longer-lived connections (e.g., TCP tunneling, HTTP keep-alives),
delay can be applied on every read/write operation rather than once.
- **Granularity:**
- Can be applied on **client** or **server** side, **ingress** or **egress**
path.
- Expressed in **milliseconds**.
### Distributions
fault implements four different distributions.
#### Uniform Distribution
!!! quote inline end ""
```mermaid
---
config:
xyChart:
showTitle: false
width: 300
height: 100
xAxis:
showTitle: false
showLabel: false
showAxisLine: false
showTick: false
yAxis:
showTitle: false
showLabel: false
showAxisLine: false
showTick: false
themeVariables:
xyChart:
backgroundColor: "#1e2429"
xAxisLineColor: "#bec3c6"
yAxisLineColor: "#bec3c6"
---
xychart-beta
title "Uniform Distribution (min=5, max=20)"
x-axis [ "5–8", "8–11", "11–14", "14–17", "17–20" ]
y-axis "Frequency" 0 --> 300
bar [ 180, 160, 190, 170, 195 ]
```
- **min**
The smallest possible delay in milliseconds.
- **max**
The largest possible delay in milliseconds.
> A uniform random draw between `min` and `max` (inclusive).
#### Normal Distribution
!!! quote inline end ""
```mermaid
---
config:
xyChart:
showTitle: false
width: 300
height: 100
xAxis:
showTitle: false
showLabel: false
showAxisLine: false
showTick: false
yAxis:
showTitle: false
showLabel: false
showAxisLine: false
showTick: false
themeVariables:
xyChart:
backgroundColor: "#1e2429"
xAxisLineColor: "#bec3c6"
yAxisLineColor: "#bec3c6"
---
xychart-beta
title "Normal Distribution (mean=10, stddev=3)"
x-axis [ "4–6", "6–8", "8–10", "10–12", "12–14" ]
y-axis "Frequency" 0 --> 400
bar [ 120, 280, 360, 280, 120 ]
```
- **mean**
The average delay in milliseconds around which most values cluster.
- **stddev**
Standard deviation, describing how spread out the delays are around the mean.
> Smaller `stddev` values produce tighter clustering around `mean`, while larger
> values spread delays more widely.
#### Pareto Distribution
!!! quote inline end ""
```mermaid
---
config:
xyChart:
showTitle: false
width: 300
height: 100
xAxis:
showTitle: false
showLabel: false
showAxisLine: false
showTick: false
yAxis:
showTitle: false
showLabel: false
showAxisLine: false
showTick: false
themeVariables:
xyChart:
backgroundColor: "#1e2429"
xAxisLineColor: "#bec3c6"
yAxisLineColor: "#bec3c6"
---
xychart-beta
title "Pareto Distribution (shape=1.5, scale=3)"
x-axis [ "3–6", "6–9", "9–12", "12–15", "15–18" ]
y-axis "Frequency" 0 --> 150
bar [ 80, 100, 120, 50, 20 ]
```
- **shape**
Governs how "heavy" the tail is. Lower `shape` implies more frequent extreme
delays; higher `shape` yields fewer large spikes.
- **scale**
Minimum threshold (in milliseconds). Delays start at `scale` and can grow
large based on the heavy tail.
#### Pareto Normal Distribution
!!! quote inline end ""
```mermaid
---
config:
xyChart:
showTitle: false
width: 300
height: 100
xAxis:
showTitle: false
showLabel: false
showAxisLine: false
showTick: false
yAxis:
showTitle: false
showLabel: false
showAxisLine: false
showTick: false
themeVariables:
xyChart:
backgroundColor: "#1e2429"
xAxisLineColor: "#bec3c6"
yAxisLineColor: "#bec3c6"
---
xychart-beta
title "Pareto-Normal Distribution (mean=10, stddev=3, shape=1.5, scale=3)"
x-axis [ "4–6", "6–8", "8–10", "10–12", "12–14", "14–16", "16–18", "18–24", "24–40" ]
y-axis "Frequency" 0 --> 200
bar [ 20, 60, 130, 180, 160, 120, 80, 50, 30 ]
```
- **mean** and **stddev**
Define the normal portion of the distribution, where most delays cluster near
`mean`.
- **shape** and **scale**
Introduce a heavy-tailed component, allowing for occasional large spikes above
the normal baseline.
## Jitter
**Definition**
Jitter is a network fault that introduces random, unpredictable delays into
packet transmission. Unlike fixed latency, jitter fluctuates on a per-operation
basis, emulating the natural variance seen in real-world network conditions.
This can help reveal how well an application copes with irregular timing and
bursty network behavior.
### Key Characteristics
- **Per-Operation Application**
Jitter is applied to individual operations (reads and/or writes) rather than
as a one‑time delay for an entire connection. This accurately models scenarios
where network delay fluctuates with each packet.
- **Application Side**
The fault can be applied between different segments of a connection:
- Client Side: Limits data moving from the client to the proxy.
- Server Side: Caps data flow from the proxy to the upstream server.
- **Direction**
The fault can be targeted to affect either the inbound traffic (ingress),
outbound traffic (egress), or both, allowing you to simulate delays on one or
both sides of a connection.
- **Amplitude**
This parameter defines the maximum delay, expressed in milliseconds, that can
be randomly applied to an operation. It sets the upper bound on how severe
each individual delay can be.
- **Frequency**
Frequency indicates how often the jitter fault is applied, measured in Hertz
(the number of times per second). Higher frequencies simulate more frequent
variability in delay.
## Bandwidth
**Definition**
Bandwidth is a network fault that simulates a limited throughput by capping
the rate at which data can be transmitted. In effect, it imposes a throttle on
the flow of information, causing delays when the amount of data exceeds the
defined maximum transfer rate.
### Key Characteristics
- **Application Side**
The fault can be applied between different segments of a connection:
- Client Side: Limits data moving from the client to the proxy.
- Server Side: Caps data flow from the proxy to the upstream server.
- **Direction**
The fault can be targeted to affect either the inbound traffic (ingress),
outbound traffic (egress), or both, allowing you to simulate delays on one or
both sides of a connection.
- **Rate Limit and Unit**
The core of the bandwidth fault is its transfer rate - defined as a positive
integer value paired with a unit. The unit (Bps, KBps, MBps, or GBps)
specifies the scale of the limitation. In practice, this value represents the
maximum number of bytes (or kilobytes, megabytes, etc.) that can be
transmitted per second. When data exceeds the allowed rate, additional bytes
are delayed, effectively throttling the connection.
## Blackhole
**Definition**
The Blackhole network fault causes packets to vanish - effectively discarding or
"dropping" the traffic. When this fault is enabled, data sent over the affected
network path is simply lost, simulating scenarios such as misconfigured routing,
severe network congestion, or complete link failure. This helps test how well an
application or service manages lost packets and timeouts.
### Key Characteristics
- **Application Side**
The fault can be applied between different segments of a connection:
- Client Side: Limits data moving from the client to the proxy.
- Server Side: Caps data flow from the proxy to the upstream server.
- **Direction**
The fault can be targeted to affect either the inbound traffic (ingress),
outbound traffic (egress), or both, allowing you to simulate delays on one or
both sides of a connection.
- **Fault Behavior**
When active, the Blackhole simply discards the affected packets. There is no
acknowledgment or error sent back to the sender. This mimics real-world
conditions where faulty network paths silently drop traffic, often leading to
connection timeouts and degraded performance.
## Packet Loss
**Definition**
Packet Loss is a network fault that randomly drops a certain percentage of
packets. In this mode, some packets are lost in transit instead of being
delivered to their destination. This fault simulates real-world conditions such
as unreliable networks, congestion, or hardware issues that cause intermittent
communication failures.
### Key Characteristics
- **Application Side**
The fault can be applied between different segments of a connection:
- Client Side: Limits data moving from the client to the proxy.
- Server Side: Caps data flow from the proxy to the upstream server.
- **Direction**
The fault can be targeted to affect either the inbound traffic (ingress),
outbound traffic (egress), or both, allowing you to simulate delays on one or
both sides of a connection.
- **Fault Behavior**
The packet loss fault randomly discards packets. Unlike blackholing, which
silently discards all packets on a given path, packet loss is typically
configured to drop only a fraction of packets. This can create intermittent
failures that test the application's ability to handle retransmissions,
timeouts, or other compensatory mechanisms.
## HTTP Error
**Definition**
The HTTP Response fault intercepts HTTP requests and returns a predefined HTTP
error response immediately, without forwarding the request to the upstream
server. This fault simulates scenarios where a service deliberately returns an
error (e.g., due to misconfiguration or overload), enabling you to test how the
client and application behave when receiving error responses.
### Key Characteristics
- **Fault Enablement**
When enabled, the proxy responds with an HTTP error response instead of
passing the request through. This behavior bypasses any normal processing by
the backend service.
- **Status Code and Body**
- **HTTP Response Status**
You can specify which HTTP status code to return (defaulting to 500).
- **Optional Response Body**
An optional HTTP body can be provided so that clients receive not only a
status code but also explanatory content.
These settings allow the simulation of different error scenarios (e.g.,
404 for "Not Found", 503 for "Service Unavailable").
- **Trigger Probability**
The fault is applied probabilistically based on a trigger probability between
0.0 and 1.0 (default 1.0). A value less than 1.0 means that only a fraction of
the requests will trigger the error response, enabling the simulation of
intermittent errors rather than constant failure.
- **Impact on Communication**
This fault terminates the normal request–response cycle by immediately
returning the error response. It is useful in tests where you need to verify
that error handling or failover mechanisms in your client application are
functioning correctly.
# CLI Reference
This document provides an overview of the CLI. The CLI is organized into a
single command with grouped parameters, allowing you to configure and run
the proxy with various network fault simulations, execute test scenarios
defined in a file or launch a local demo server.
---
## Commands
### `run`
Run the proxy with fault injection enabled. This command applies the specified
network faults to TCP streams and HTTP requests.
It has two subcommands to specifically explore LLM and database use-cases.
### `inject`
Inject the fault proxy into your platform resources, such as Kubernetes.
### `scenario`
Execute a predefined fault injection scenario. This command includes additional
subcommands for building scenarios from OpenAPI specification.
### `agent`
Run a MCP Server and tools.
Analyze scenario results and suggest code changes using LLM.
### `demo`
Run a simple demo server for learning purposes, with various fault simulation
options available.
---
## Global Options
These options apply across all commands.
- **`--log-file
# Run fault as a Chaos Toolkit Action
This guide will walk you through running fault as a [Chaos Toolkit][ctk] action
in your Chaos Engineering experiments.
[ctk]: https://chaostoolkit.org/
[exp]: https://chaostoolkit.org/reference/api/experiment/
[pypa]: https://packaging.python.org/en/latest/tutorials/installing-packages/
[ctkfault]: https://github.com/chaostoolkit-incubator/chaostoolkit-fault
??? abstract "Prerequisites"
- [X] Install fault
If you haven’t installed fault yet, follow the
[installation instructions](../../install.md).
- [X] Install Chaos Toolkit
If you haven’t installed Chaos Toolkit yet, follow the
[installation instructions](https://chaostoolkit.org/reference/usage/install/).
## Run with the Chaos Toolkit fault Extension
- [X] Install the {==chaostoolkit-fault==} extension
??? note
Chaos Toolkit extensions are Python libraries that must be found by the
`chaos` process when it runs. Usually, this requires you install these
extensions as part of your [Python environment][pypa]. There are many
ways to get a Python environment, so we'll assume you are running one.
Install the [chaostoolkit-fault][ctkfault] extension:
=== "pip"
```bash
pip install chaostoolkit-fault
```
=== "uv"
```bash
uv tool install chaostoolkit-fault
```
- [X] Add an action to run the proxy
You can now add the following to one of your experiment:
=== "json"
```json
{
"type": "action",
"name": "run fault proxy with a normal distribution latency",
"provider": {
"type": "python",
"module": "chaosfault.actions",
"func": "run_proxy",
"arguments": {
"proxy_args": "--with-latency --latency-mean 300 --latency-stddev 50 --upstream '*'"
}
},
"background": true
}
```
=== "yaml"
```yaml
---
type: action
name: run fault proxy with a normal distribution latency
provider:
type: python
module: chaosfault.actions
func: run_proxy
arguments:
proxy_args: "--with-latency --latency-mean 300 --latency-stddev 50 --upstream '*'"
background: true
```
You mostly likely want to run the proxy as a background task of the
experiment.
The `proxy_args` argument takes the full list of supported values from the
[cli run command](../reference/cli-commands.md#run-command-options)
- [X] Add an action to stop the proxy
You can now add the following action once your experiment is done with
the proxy.
=== "json"
```json
{
"type": "action",
"name": "stop latency proxy injector",
"provider": {
"type": "python",
"module": "chaosfault.actions",
"func": "stop_proxy"
}
}
```
=== "yaml"
```yaml
---
type: action
name: stop latency proxy injector
provider:
type: python
module: chaosfault.actions
func: stop_proxy
```
!!! tip
You can do without this action if you set the `duration` argument when
you start the proxy. In which case, the proxy will terminate on its
own after the duration is up.
## Next Steps
- Explore how you can use the [Reliably Platform](run-with-reliably.md) to
orchestrate and schedule your experiment on a variety of targets.
# Run fault as a Reliably Plan
This guide will walk you through running fault as part of a
[Reliably Plan][reliably].
[reliably]: https://reliably.com
??? abstract "Prerequisites"
This guide assumes you have an account on a Reliably platform instance.
## Run as part of a Reliably Plan
- [X] Create the Reliably Experiment
To create the Experiment, go to the {==Builder==} page. Look for the
{==Rebound fault==} target and select the {==Run Network Fault Proxy==}
action.

Once select, a new page opens and allows you to fill the details of your
experiment.
* Set a meaninful title and description
* Set tags that will allow members to filter experiments
* Set contributions which define the dimensions impacted by the experiment
Next, fill the experiment's activities:

Pass the [proxy CLI arguments](../reference/cli-commands.md#run-command-options)
as you would to the `fault run` command itself. For instance, let's use the
following argument line:
```bash
--duration 45s \
--with-latency \ # (1)!
--latency-mean 300 \ # (2)!
--latency-sched "duration:10s;start:25s,duration:17s" # (3)!
```
1. Run `fault` with a `latency` fault
2. Inject a `300ms` delay on responses
3. Inject the fault only for around `60%` of the total duration of the run
We suggest you run the action in background so that other activities can
take place while it is running.
Finally, if you did not set the `--duration` flag, you want to keep the
{==Stop Network Proxy==} action so that your proxy is properly terminated.
In such case, remember you can only set
[fixed schedules](../how-to/proxy/lifecycle.md#scheduling).
At that stage you may want to insert new activities once the proxy has
started by clicking the little `+` icon on the right of the
{==Run Network Fault Proxy==} activity.
For instance, you could run a basic load test and send its traffic via
the proxy. Choose the {==Run Simple Load Test==} action from the Reliably
target provider. Fill the target URL and, at the bottom of the action,
set the proxy url to `http://localhost:3180` which is the proxy's address.
Save now the experiment which redirects you to its page.

- [X] Schedule the Reliably Plan
Click now on the {==Run experiment==} button which leads you to the
Reliably Plan form.

Select now the appropriate deployment to run the experiment. If, you need
to pass specific Environment variables, you may set the {==Environment==}
as well.
On this example, we also enable the {==Open AI==} extension which will
send the experiment's questions to [OpenAI](https://platform.openai.com)
while the plan runs.
!!! info
No other information is ever sent to OpenAI.
The plan will then be scheduled to start immediately.

- [X] Review the Reliably Execution
Once the plan has completed, you may review its execution. Below is the
timeline of this execution:

Zooming into the {==Run Simple Load Test==} step, we can indeed see how
around 60% of the requests were impacted by our latency.

As a bonus point, we can also see that our questions to OpenAI were keenly
answered:

The assistant exposes the theory behind exploring latency and moves on
to show us a Chaos Toolkit experiment. Remember that a Chaos Toolkit
experiment can be imported and used as a Reliably Experiment.
!!! warning "Critical thinking remains your best strategy"
LLM models are known to hallucinate at times. More than often, the LLM
will suggest Chaos Toolkit activities that don't exist. Nonetheless,
it's a valuable discussion starting point.

The assistant expands on its reply with more useful context about what to
look for as your run such an experiment.
Overall, the assistant is here to support your own analysis and you should
use it as a data point only, not as the one truth.
Finally, the assistant also responds to the question about well-known
incidents, which may help put your experiment into context:

## Next Steps
- **Explore [Reliably](https://reliably.com)** to understand how you can run
a plan on various deployment targets.
# Generate Automated Resilience Testing Scenarios
This guide will walk you through generating fault resilience scenarios that you
can run automatically to validate the capability of your endpoints to deal
with network issues.
!!! abstract "Prerequisites"
- [X] Install fault
If you haven’t installed fault yet, follow the
[installation instructions](../install.md).
- [X] Scenario Reference
You might want to familiar yourself with the
[scenario reference](../../reference/scenario-file-format.md).
## Create Single Shot Scenarios
In this guide, we will demonstrate how to create a single scenario against the
fault demo application. Single call scenarios make only one request to the
target endpoint.
- [X] Start demo application provided by fault
```bash
fault demo run
```
- [X] Create the scenario file
The following scenario runs a single HTTP request against the
`/ping` endpoint of the demo application. That endpoint in turns make
a request to `https://postman-echo.com` which is the call our scenario
will impact with a light latency.
```yaml title="scenario.yaml"
--- # (1)!
title: "Add 80ms latency to ingress from the remote service and expects we verify our expectations"
description: "Our endpoint makes a remote call which may not respond appropriately, we need to decide how this impacts our own users"
items: # (2)!
- call:
method: GET
url: http://localhost:7070/ping
context:
upstreams:
- https://postman-echo.com # (3)!
faults: # (4)!
- type: latency
mean: 80
stddev: 5
expect:
status: 200 # (5)!
response_time_under: 500 # (6)!
```
1. A scenario file may have as many scenarios as you want
2. You may group several calls, and their own context, per scenario
3. This is the host impacted by the latency
4. You may apply multiple faults at the same time
5. We do not tolerate the call to fail
6. We expect to respond globally under `500ms`
## Create Repeated Call Scenarios
In this guide, we will demonstrate how to create a repeated scenario against the
fault demo application. Repated call scenarios make a determinitic number of
requests to the target endpoint, with the possibility to increase some of the
fault parameters by a step on each iteration.
- [X] Start demo application provided by fault
```bash
fault demo run
```
- [X] Create the scenario file
The following scenario runs several HTTP requests against the
`/ping` endpoint of the demo application. That endpoint in turns make
a request to `https://postman-echo.com` which is the call our scenario
will impact with a light latency.
```yaml title="scenario.yaml"
--- # (1)!
title: "Start with 80ms latency and increase it by 30ms to ingress from the remote service and expects we verify our expectations"
description: "Our endpoint makes a remote call which may not respond appropriately, we need to decide how this impacts our own users"
items: # (2)!
- call:
method: GET
url: http://localhost:7070/ping
context:
upstreams:
- https://postman-echo.com # (3)!
strategy: # (4)!
mode: repeat
step: 30 # (5)!
count: 3 # (6)!
add_baseline_call: true # (7)!
faults: # (8)!
- type: latency
mean: 80
stddev: 5
expect:
status: 200 # (9)!
response_time_under: 500 # (10)!
```
1. A scenario file may have as many scenarios as you want
2. You may group several calls, and their own context, per scenario
3. This is the host impacted by the latency
4. The `strategy` block defines how fault should run this scenario's call
5. The step by which we increase latency on each iteration
6. How many iterations we iterate
7. Do we have a baseline call, without fault, at the start?
8. You may apply multiple faults at the same time
9. We do not tolerate the call to fail
10. We expect to respond globally under `500ms`
## Create Load Test Call Scenarios
In this guide, we will demonstrate how to create a load test scenario against
the fault demo application. Load test call scenarios make a number of
requests to the target endpoint over a duration.
!!! warning
fault is not a full-blown load testing tool. It doesn't aim at becoming
one. The facility provided by this strategy is merely a convenience for
very small load tests. It can prove very useful nonetheless.
- [X] Start demo application provided by fault
```bash
fault demo run
```
- [X] Create the scenario file
The following scenario runs several HTTP requests against the
`/` endpoint of the demo application.
```yaml title="scenario.yaml"
--- # (1)!
title: "Sustained latency with a short loss of network traffic"
description: "Over a period of 10s, inject a 90ms latency. After 3s and for a period of 2s also send traffic to nowhere."
items: # (2)!
- call:
method: GET
url: http://localhost:7070/
context:
upstreams:
- http://localhost:7070 # (3)!
strategy: # (4)!
mode: load
duration: 10s # (5)!
clients: 3 # (6)!
rps: 2 # (7)!
faults:
- type: latency
global: false # (8)!
mean: 90
- type: blackhole
period: "start:30%,duration:20%" # (9)!
slo: # (10)!
- type: latency
title: "P95 Latency < 110ms"
objective: 95
threshold: 110.0
- type: latency
title: "P99 Latency < 200ms"
objective: 99
threshold: 200.0
- type: error
title: "P98 Error Rate < 1%"
objective: 98
threshold: 1
```
1. A scenario file may have as many scenarios as you want
2. You may group several calls, and their own context, per scenario
3. This is the host impacted by the latency
4. The `strategy` block defines how fault should run this scenario's call
5. The total duration of our test. We support the following [units](https://docs.rs/parse_duration/latest/parse_duration/#units)
6. The number of connected clients
7. The number of request per second per client
8. Inject latency for each read/write operation, not just once
9. Schedule the blackhole fault for a period of the total duration only
10. Rather thana single status code and latency, we evaluate SLO against the load results
The load strategy is powerful because it allows you to explore the
application's behavior over a period of time while keeping a similar
approach to other strategies.
Notably, you should remark how we can apply the faults with a schedule
so you can see how they impact the application when they come and go. You
should also note the use of SLO to review the results in light of service
expectations over period of times.
Please read more about these capabilities in the
[scenario reference](../../reference/scenario-file-format.md).
## Generate Scenarios from an OpenAPI Specification
This guide shows you can swiftly generate common basic scenarios for a large
quantity of endpoints discovered from an OpenAPI specification.
!!! info
fault can generate scenarios from OpenAPI
[v3.0.x](https://spec.openapis.org/oas/v3.0.3.html) and
[v3.1.x](https://spec.openapis.org/oas/v3.1.1.html).
- [X] Generate from a specification file
```bash
fault scenario generate --scenario scenario.yaml --spec-file openapi.yaml
```
- [X] Generate from a specification URL
```bash
fault scenario generate --scenario scenario.yaml --spec-url http://myhost/openapi.json
```
- [X] Generate one scenario file per endpoint
```bash
fault scenario generate \
--scenario scenarios/ \ # (1)!
--spec-url http://myhost/openapi.json
Generated 24 reliability scenarios across 3 endpoints!
```
1. Pass a directory where the files will be stored
This approach is nice to quickly generate scenarios but if your specification
is large, you will endup with hundreds of them. Indeed, fault will create
tests for single shot, repeated calls or load tests. All of these with a
combination of faults.
We suggest you trim down only to what you really want to explore. Moreover,
you will need to edit the scenarios for placeholders and other headers
needed to make the calls.
Below is an example of a generated scenarios against the
[Reliably platform](https://reliably.com):
```yaml
title: Single high-latency spike (client ingress)
description: A single 800ms spike simulates jitter buffer underrun / GC pause on client network stack.
items:
- call:
method: GET
url: http://localhost:8090/api/v1/organization/{org_id}/experiments/all
meta:
operation_id: all_experiments_api_v1_organization__org_id__experiments_all_get
context:
upstreams:
- http://localhost:8090/api/v1/organization/{org_id}/experiments/all
faults:
- type: latency
side: client
mean: 800.0
stddev: 100.0
direction: ingress
strategy: null
expect:
status: 200
```
!!! abstract "Read more about scenarios..."
[Learn more](../../reference/scenario-file-format.md) about scenarios and
explore their capabilities.
## Pass Headers to the Scenario
In this guide, you will learn how to provide HTTP headers to the request made
for a scenario.
- [X] Start demo application provided by fault
```bash
fault demo run
```
- [X] Create the scenario file
The following scenario runs a single HTTP request against the
`/ping` endpoint of the demo application. That endpoint in turns make
a request to `https://postman-echo.com` which is the call our scenario
will impact with a light latency.
```yaml title="scenario.yaml"
---
title: "Add 80ms latency to ingress from the remote service and expects we verify our expectations"
description: "Our endpoint makes a remote call which may not respond appropriately, we need to decide how this impacts our own users"
items:
- call:
method: GET
url: http://localhost:7070/ping
headers:
Authorization: bearer token # (1)!
context:
upstreams:
- https://postman-echo.com
faults:
- type: latency
mean: 80
stddev: 5
expect:
status: 200
response_time_under: 500
```
1. Pass headers as a mapping of `key: value` pairs. Note in the particular
case of the `Authorization` header, its value will not be shown as par
of the report but replaced by a placeholder opaque string.
## Make Requests With a Body
In this guide, you will learn how to pass a body string to the request.
- [X] Start demo application provided by fault
```bash
fault demo run
```
- [X] Create the scenario file
The following scenario runs a single HTTP request against the
`/ping` endpoint of the demo application. That endpoint in turns make
a request to `https://postman-echo.com` which is the call our scenario
will impact with a light latency.
```yaml title="scenario.yaml"
---
title: "Add 80ms latency to ingress from the remote service and expects we verify our expectations"
description: "Our endpoint makes a remote call which may not respond appropriately, we need to decide how this impacts our own users"
items:
- call:
method: POST # (1)!
url: http://localhost:7070/ping
headers:
Content-Type: application/json # (2)!
body: '{"message": "hello there"}' # (3)!
context:
upstreams:
- https://postman-echo.com
faults:
- type: latency
mean: 80
stddev: 5
expect:
status: 200
response_time_under: 500
```
1. Set the method to `POST`
2. Pass the actual body content-type.
3. Pass the body as an encoded string
## Bring on your SRE hat
When running scenarios with a {==load==} or {==repeat==} strategy, we encourage
you to bring SLO into their context. They will give you invaluable insights
about the expectations that could be broken due to a typical faults combination.
```yaml
slo:
- type: latency
title: "P95 Latency < 110ms"
objective: 95
threshold: 110.0
- type: latency
title: "P99 Latency < 200ms"
objective: 99
threshold: 200.0
- type: error
title: "P98 Error Rate < 1%"
objective: 98
threshold: 1
```
fault supports two types of SLO: `latency` and `error`. When a scenario is
executed, the generated report contains an analysis of the results of the run
against these objectives. It will decide if broke them or not based on the
volume of traffic and duration of the scenario.
## Next Steps
- **Learn how to [run](./run.md)** these scenarios.
- **Explore the [specification reference](../../reference/scenario-file-format.md)**
for scenarios.
# Explore Scenario Reports
In this guide, you will learn how to interpret the reports generated from
running scenarios.
??? abstract "Prerequisites"
- [X] Install fault
If you haven’t installed fault yet, follow the
[installation instructions](../install.md).
- [X] Generate Scenario Files
If you haven’t created a scenario file, please read this
[guide](./generate.md).
- [X] Run Scenario Files
If you haven’t executed scenario files, please read this
[guide](./run.md).
## Results vs Report
faulfaultt generates two assets when running scenarios:
* `results.json` an extensive account of what happened during the run, including
a detailed trace of all the faults that were injected
* `report.md` a markdown high-level report from a run
## Report Example
Below is an example of a generated markdown report.
---
## Scenarios Report
Start: 2025-05-05 11:20:12.665603456 UTC
End: 2025-05-05 11:20:37.004974829 UTC
### Scenario: Latency Increase By 30ms Steps From Downstream (items: 6)
#### 🎯 `GET` http://localhost:7070/ping | Passed
**Call**:
- Method: `GET`
- Timeout: -
- Headers: -
- Body?: No
**Strategy**: single shot
**Faults Applied**:
- Latency: ➡️🖧, Per Read/Write Op.: false, Mean: 80.00 ms, Stddev: 5.00 ms
**Expectation**: Response time Under 490ms | Status Code 200
**Run Overview**:
| Num. Requests | Num. Errors | Min. Response Time | Max Response Time | Mean Latency (ms) | Expectation Failures | Total Time |
|-----------|---------|--------------------|-------------------|-------------------|----------------------|------------|
| 1 | 0 (0.0%) | 457.66 | 457.66 | 457.66 | 0 | 464 ms |
| Latency Percentile | Latency (ms) | Num. Requests (% of total) |
|------------|--------------|-----------|
| p25 | 457.66 | 1 (100.0%) |
| p50 | 457.66 | 1 (100.0%) |
| p75 | 457.66 | 1 (100.0%) |
| p95 | 457.66 | 1 (100.0%) |
| p99 | 457.66 | 1 (100.0%) |
#### 🎯 `GET` http://localhost:7070/ping | Failed
**Call**:
- Method: `GET`
- Timeout: -
- Headers: -
- Body?: No
**Strategy**: repeat 3 times with a step of 30
**Faults Applied**:
- Latency: ➡️🖧, Per Read/Write Op.: false, Mean: 80.00 ms, Stddev: 5.00 ms
**Expectation**: Response time Under 390ms | Status Code 200
**Run Overview**:
| Num. Requests | Num. Errors | Min. Response Time | Max Response Time | Mean Latency (ms) | Expectation Failures | Total Time |
|-----------|---------|--------------------|-------------------|-------------------|----------------------|------------|
| 4 | 0 (0.0%) | 365.09 | 838.84 | 373.65 | 1 | 1 second and 968 ms |
| Latency Percentile | Latency (ms) | Num. Requests (% of total) |
|------------|--------------|-----------|
| p25 | 365.99 | 2 (50.0%) |
| p50 | 373.65 | 3 (75.0%) |
| p75 | 723.78 | 4 (100.0%) |
| p95 | 838.84 | 4 (100.0%) |
| p99 | 838.84 | 4 (100.0%) |
| SLO | Pass? | Objective | Margin | Num. Requests Over Threshold (% of total) |
|-----------|-------|-----------|--------|--------------------------|
| P95 < 300ms | ❌ | 95% < 300ms | Above by 538.8ms | 4 (100.0%) |
#### 🎯 `GET` http://localhost:7070/ | Passed
**Call**:
- Method: `GET`
- Timeout: 500ms
- Headers:
- Authorization: xxxxxx
- X-Whatever: blah
- Body?: No
**Strategy**: load for 10s with 5 clients @ 20 RPS
**Faults Applied**:
| Type | Timeline | Description |
|------|----------|-------------|
| latency | 0% `xxxxxxxxxx` 100% | Latency: ➡️🖧, Per Read/Write Op.: true, Mean: 90.00 ms |
| blackhole | 0% `.xx.......` 100% | Blackhole: ➡️🖧 |
**Run Overview**:
| Num. Requests | Num. Errors | Min. Response Time | Max Response Time | Mean Latency (ms) | Expectation Failures | Total Time |
|-----------|---------|--------------------|-------------------|-------------------|----------------------|------------|
| 396 | 30 (7.6%) | 32.89 | 504.95 | 93.19 | 0 | 10 seconds and 179 ms |
| Latency Percentile | Latency (ms) | Num. Requests (% of total) |
|------------|--------------|-----------|
| p25 | 78.47 | 100 (25.3%) |
| p50 | 93.19 | 199 (50.3%) |
| p75 | 108.81 | 298 (75.3%) |
| p95 | 500.94 | 378 (95.5%) |
| p99 | 504.64 | 394 (99.5%) |
| SLO | Pass? | Objective | Margin | Num. Requests Over Threshold (% of total) |
|-----------|-------|-----------|--------|--------------------------|
| P95 Latency < 110ms | ❌ | 95% < 110ms | Above by 390.9ms | 92 (23.2%) |
| P99 Latency < 200ms | ❌ | 99% < 200ms | Above by 304.6ms | 30 (7.6%) |
| P98 Error Rate < 1% | ❌ | 98% < 1% | Above by 6.6 | 30 (7.6%) |
---
### Scenario: Single high latency spike (items: 1)
_Description:_ Evaluate how we tolerate one single high latency spike
#### 🎯 `GET` http://localhost:7070/ | Passed
**Call**:
- Method: `GET`
- Timeout: -
- Headers: -
- Body?: No
**Strategy**: single shot
**Faults Applied**:
- Latency: ➡️🖧, Per Read/Write Op.: false, Mean: 800.00 ms, Stddev: 100.00 ms
**Expectation**: Status Code 200
**Run Overview**:
| Num. Requests | Num. Errors | Min. Response Time | Max Response Time | Mean Latency (ms) | Expectation Failures | Total Time |
|-----------|---------|--------------------|-------------------|-------------------|----------------------|------------|
| 1 | 0 (0.0%) | 795.82 | 795.82 | 795.82 | 0 | 800 ms |
| Latency Percentile | Latency (ms) | Num. Requests (% of total) |
|------------|--------------|-----------|
| p25 | 795.82 | 1 (100.0%) |
| p50 | 795.82 | 1 (100.0%) |
| p75 | 795.82 | 1 (100.0%) |
| p95 | 795.82 | 1 (100.0%) |
| p99 | 795.82 | 1 (100.0%) |
---
### Scenario: Gradual moderate latency increase (items: 6)
_Description:_ Evaluate how we tolerate latency incrementally growing
#### 🎯 `GET` http://localhost:7070/ | Passed
**Call**:
- Method: `GET`
- Timeout: -
- Headers: -
- Body?: No
**Strategy**: repeat 5 times with a step of 100
**Faults Applied**:
- Latency: ➡️🖧, Per Read/Write Op.: false, Mean: 100.00 ms, Stddev: 30.00 ms
**Expectation**: Status Code 200
**Run Overview**:
| Num. Requests | Num. Errors | Min. Response Time | Max Response Time | Mean Latency (ms) | Expectation Failures | Total Time |
|-----------|---------|--------------------|-------------------|-------------------|----------------------|------------|
| 6 | 0 (0.0%) | 50.67 | 137.63 | 89.63 | 0 | 566 ms |
| Latency Percentile | Latency (ms) | Num. Requests (% of total) |
|------------|--------------|-----------|
| p25 | 52.03 | 2 (33.3%) |
| p50 | 89.63 | 4 (66.7%) |
| p75 | 123.53 | 6 (100.0%) |
| p95 | 137.63 | 6 (100.0%) |
| p99 | 137.63 | 6 (100.0%) |
---
### Scenario: Repeated mild latencies periods over a 10s stretch (items: 1)
_Description:_ Evaluate how we deal with periods of moderate latencies over a period of time
#### 🎯 `GET` http://localhost:7070/ | Passed
**Call**:
- Method: `GET`
- Timeout: -
- Headers: -
- Body?: No
**Strategy**: load for 10s with 3 clients @ 2 RPS
**Faults Applied**:
| Type | Timeline | Description |
|------|----------|-------------|
| latency | 0% `.xx.......` 100% | Latency: ➡️🖧, Per Read/Write Op.: false, Mean: 150.00 ms |
| latency | 0% `....xx....` 100% | Latency: ➡️🖧, Per Read/Write Op.: false, Mean: 250.00 ms |
| latency | 0% `.......xx.` 100% | Latency: ➡️🖧, Per Read/Write Op.: false, Mean: 150.00 ms |
**Run Overview**:
| Num. Requests | Num. Errors | Min. Response Time | Max Response Time | Mean Latency (ms) | Expectation Failures | Total Time |
|-----------|---------|--------------------|-------------------|-------------------|----------------------|------------|
| 60 | 0 (0.0%) | 0.27 | 616.96 | 524.52 | 0 | 10 seconds and 330 ms |
| Latency Percentile | Latency (ms) | Num. Requests (% of total) |
|------------|--------------|-----------|
| p25 | 401.47 | 16 (26.7%) |
| p50 | 524.52 | 31 (51.7%) |
| p75 | 550.17 | 46 (76.7%) |
| p95 | 596.09 | 58 (96.7%) |
| p99 | 616.96 | 60 (100.0%) |
| SLO | Pass? | Objective | Margin | Num. Requests Over Threshold (% of total) |
|-----------|-------|-----------|--------|--------------------------|
| P95 Latency < 110ms | ❌ | 95% < 110ms | Above by 486.1ms | 54 (90.0%) |
| P99 Latency < 200ms | ❌ | 99% < 200ms | Above by 417.0ms | 54 (90.0%) |
| P98 Error Rate < 1% | ✅ | 98% < 1% | Below by 1.0 | 0 (0.0%) |
---
# Run fault Scenarios
In this guide, you will learn how to run fault scenarios and read the generated
report.
??? abstract "Prerequisites"
- [X] Install fault
If you haven’t installed fault yet, follow the
[installation instructions](../install.md).
- [X] Generate Scenario Files
If you haven’t created a scenario file, please read this
[guide](./generate.md).
## Run a Scenario File
We will explore now how to run scenarios generated to verify the resilience of
the fault demo application itself.
- [X] Start demo application provided by fault
```bash
fault demo run # (1)!
```
1. The application under test must be started for the scenario to be
meaningful. Otherwise, the scenarios will all fail.
- [X] Run a scenario file
```bash
fault scenario run --scenario scenario.yaml
```
## Run Many Scenario Files
We will explore now how to run scenarios generated to verify the resilience of
the fault demo application itself. In this specific use case, we assume you want
to run many scenario files at once and that they are located in the
same directory.
- [X] Start demo application provided by fault
```bash
fault demo run # (1)!
```
1. The application under test must be started for the scenario to be
meaningful. Otherwise, the scenarios will all fail.
- [X] Run scenario files located in a directory
```bash
fault scenario run --scenario scenarios/ # (1)!
```
1. fault will load all YAML files in that directory.
## Run a Scenario on Kubernetes
The default behavior is to execute a scenario locally to where the command
is started. A scenario offers a way to run the proxy [from within a Kubernetes
cluster](../../reference/scenario-file-format.md#running-on-a-platform).
- [X] Configure the scenario to run on a Kubernetes cluster
```yaml
context:
runs_on:
platform: kubernetes
ns: default # (1)!
service: nginx # (2)!
```
1. The namespace of the target service
2. The target service which should be part of the test chain
The scenario will be executed locally but the proxy will be deployed inside
the cluster directly.
## Next Steps
- **Learn how to explore the generated [report](./reporting.md)** from running these scenarios.
- **Explore the [specification reference](../../reference/scenario-file-format.md)**
for scenarios.
#
# Built-in Faults
fault comes with a set of builtin faults. This page explores each fault
and how they get applied.
## Latency
**Definition**
A network fault that delays traffic by a specified amount of time. Latency
commonly contributes to degraded user experience and is often used to simulate
real-world connection slowdowns.
### Key Characteristics
- **Application Side**
The fault can be applied between different segments of a connection:
- Client Side: Limits data moving from the client to the proxy.
- Server Side: Caps data flow from the proxy to the upstream server.
- **Direction**
The fault can be targeted to affect either the inbound traffic (ingress),
outbound traffic (egress), or both, allowing you to simulate delays on one or
both sides of a connection.
- **Timing:**
- **Once per connection**
Useful for request/response communication (e.g., HTTP). Applies a single
delay on the first operation (read or write).
- **Per-operation**
For longer-lived connections (e.g., TCP tunneling, HTTP keep-alives),
delay can be applied on every read/write operation rather than once.
- **Granularity:**
- Can be applied on **client** or **server** side, **ingress** or **egress**
path.
- Expressed in **milliseconds**.
### Distributions
fault implements four different distributions.
#### Uniform Distribution
!!! quote inline end ""
```mermaid
---
config:
xyChart:
showTitle: false
width: 300
height: 100
xAxis:
showTitle: false
showLabel: false
showAxisLine: false
showTick: false
yAxis:
showTitle: false
showLabel: false
showAxisLine: false
showTick: false
themeVariables:
xyChart:
backgroundColor: "#1e2429"
xAxisLineColor: "#bec3c6"
yAxisLineColor: "#bec3c6"
---
xychart-beta
title "Uniform Distribution (min=5, max=20)"
x-axis [ "5–8", "8–11", "11–14", "14–17", "17–20" ]
y-axis "Frequency" 0 --> 300
bar [ 180, 160, 190, 170, 195 ]
```
- **min**
The smallest possible delay in milliseconds.
- **max**
The largest possible delay in milliseconds.
> A uniform random draw between `min` and `max` (inclusive).
#### Normal Distribution
!!! quote inline end ""
```mermaid
---
config:
xyChart:
showTitle: false
width: 300
height: 100
xAxis:
showTitle: false
showLabel: false
showAxisLine: false
showTick: false
yAxis:
showTitle: false
showLabel: false
showAxisLine: false
showTick: false
themeVariables:
xyChart:
backgroundColor: "#1e2429"
xAxisLineColor: "#bec3c6"
yAxisLineColor: "#bec3c6"
---
xychart-beta
title "Normal Distribution (mean=10, stddev=3)"
x-axis [ "4–6", "6–8", "8–10", "10–12", "12–14" ]
y-axis "Frequency" 0 --> 400
bar [ 120, 280, 360, 280, 120 ]
```
- **mean**
The average delay in milliseconds around which most values cluster.
- **stddev**
Standard deviation, describing how spread out the delays are around the mean.
> Smaller `stddev` values produce tighter clustering around `mean`, while larger
> values spread delays more widely.
#### Pareto Distribution
!!! quote inline end ""
```mermaid
---
config:
xyChart:
showTitle: false
width: 300
height: 100
xAxis:
showTitle: false
showLabel: false
showAxisLine: false
showTick: false
yAxis:
showTitle: false
showLabel: false
showAxisLine: false
showTick: false
themeVariables:
xyChart:
backgroundColor: "#1e2429"
xAxisLineColor: "#bec3c6"
yAxisLineColor: "#bec3c6"
---
xychart-beta
title "Pareto Distribution (shape=1.5, scale=3)"
x-axis [ "3–6", "6–9", "9–12", "12–15", "15–18" ]
y-axis "Frequency" 0 --> 150
bar [ 80, 100, 120, 50, 20 ]
```
- **shape**
Governs how "heavy" the tail is. Lower `shape` implies more frequent extreme
delays; higher `shape` yields fewer large spikes.
- **scale**
Minimum threshold (in milliseconds). Delays start at `scale` and can grow
large based on the heavy tail.
#### Pareto Normal Distribution
!!! quote inline end ""
```mermaid
---
config:
xyChart:
showTitle: false
width: 300
height: 100
xAxis:
showTitle: false
showLabel: false
showAxisLine: false
showTick: false
yAxis:
showTitle: false
showLabel: false
showAxisLine: false
showTick: false
themeVariables:
xyChart:
backgroundColor: "#1e2429"
xAxisLineColor: "#bec3c6"
yAxisLineColor: "#bec3c6"
---
xychart-beta
title "Pareto-Normal Distribution (mean=10, stddev=3, shape=1.5, scale=3)"
x-axis [ "4–6", "6–8", "8–10", "10–12", "12–14", "14–16", "16–18", "18–24", "24–40" ]
y-axis "Frequency" 0 --> 200
bar [ 20, 60, 130, 180, 160, 120, 80, 50, 30 ]
```
- **mean** and **stddev**
Define the normal portion of the distribution, where most delays cluster near
`mean`.
- **shape** and **scale**
Introduce a heavy-tailed component, allowing for occasional large spikes above
the normal baseline.
## Jitter
**Definition**
Jitter is a network fault that introduces random, unpredictable delays into
packet transmission. Unlike fixed latency, jitter fluctuates on a per-operation
basis, emulating the natural variance seen in real-world network conditions.
This can help reveal how well an application copes with irregular timing and
bursty network behavior.
### Key Characteristics
- **Per-Operation Application**
Jitter is applied to individual operations (reads and/or writes) rather than
as a one‑time delay for an entire connection. This accurately models scenarios
where network delay fluctuates with each packet.
- **Application Side**
The fault can be applied between different segments of a connection:
- Client Side: Limits data moving from the client to the proxy.
- Server Side: Caps data flow from the proxy to the upstream server.
- **Direction**
The fault can be targeted to affect either the inbound traffic (ingress),
outbound traffic (egress), or both, allowing you to simulate delays on one or
both sides of a connection.
- **Amplitude**
This parameter defines the maximum delay, expressed in milliseconds, that can
be randomly applied to an operation. It sets the upper bound on how severe
each individual delay can be.
- **Frequency**
Frequency indicates how often the jitter fault is applied, measured in Hertz
(the number of times per second). Higher frequencies simulate more frequent
variability in delay.
## Bandwidth
**Definition**
Bandwidth is a network fault that simulates a limited throughput by capping
the rate at which data can be transmitted. In effect, it imposes a throttle on
the flow of information, causing delays when the amount of data exceeds the
defined maximum transfer rate.
### Key Characteristics
- **Application Side**
The fault can be applied between different segments of a connection:
- Client Side: Limits data moving from the client to the proxy.
- Server Side: Caps data flow from the proxy to the upstream server.
- **Direction**
The fault can be targeted to affect either the inbound traffic (ingress),
outbound traffic (egress), or both, allowing you to simulate delays on one or
both sides of a connection.
- **Rate Limit and Unit**
The core of the bandwidth fault is its transfer rate - defined as a positive
integer value paired with a unit. The unit (Bps, KBps, MBps, or GBps)
specifies the scale of the limitation. In practice, this value represents the
maximum number of bytes (or kilobytes, megabytes, etc.) that can be
transmitted per second. When data exceeds the allowed rate, additional bytes
are delayed, effectively throttling the connection.
## Blackhole
**Definition**
The Blackhole network fault causes packets to vanish - effectively discarding or
"dropping" the traffic. When this fault is enabled, data sent over the affected
network path is simply lost, simulating scenarios such as misconfigured routing,
severe network congestion, or complete link failure. This helps test how well an
application or service manages lost packets and timeouts.
### Key Characteristics
- **Application Side**
The fault can be applied between different segments of a connection:
- Client Side: Limits data moving from the client to the proxy.
- Server Side: Caps data flow from the proxy to the upstream server.
- **Direction**
The fault can be targeted to affect either the inbound traffic (ingress),
outbound traffic (egress), or both, allowing you to simulate delays on one or
both sides of a connection.
- **Fault Behavior**
When active, the Blackhole simply discards the affected packets. There is no
acknowledgment or error sent back to the sender. This mimics real-world
conditions where faulty network paths silently drop traffic, often leading to
connection timeouts and degraded performance.
## Packet Loss
**Definition**
Packet Loss is a network fault that randomly drops a certain percentage of
packets. In this mode, some packets are lost in transit instead of being
delivered to their destination. This fault simulates real-world conditions such
as unreliable networks, congestion, or hardware issues that cause intermittent
communication failures.
### Key Characteristics
- **Application Side**
The fault can be applied between different segments of a connection:
- Client Side: Limits data moving from the client to the proxy.
- Server Side: Caps data flow from the proxy to the upstream server.
- **Direction**
The fault can be targeted to affect either the inbound traffic (ingress),
outbound traffic (egress), or both, allowing you to simulate delays on one or
both sides of a connection.
- **Fault Behavior**
The packet loss fault randomly discards packets. Unlike blackholing, which
silently discards all packets on a given path, packet loss is typically
configured to drop only a fraction of packets. This can create intermittent
failures that test the application's ability to handle retransmissions,
timeouts, or other compensatory mechanisms.
## HTTP Error
**Definition**
The HTTP Response fault intercepts HTTP requests and returns a predefined HTTP
error response immediately, without forwarding the request to the upstream
server. This fault simulates scenarios where a service deliberately returns an
error (e.g., due to misconfiguration or overload), enabling you to test how the
client and application behave when receiving error responses.
### Key Characteristics
- **Fault Enablement**
When enabled, the proxy responds with an HTTP error response instead of
passing the request through. This behavior bypasses any normal processing by
the backend service.
- **Status Code and Body**
- **HTTP Response Status**
You can specify which HTTP status code to return (defaulting to 500).
- **Optional Response Body**
An optional HTTP body can be provided so that clients receive not only a
status code but also explanatory content.
These settings allow the simulation of different error scenarios (e.g.,
404 for "Not Found", 503 for "Service Unavailable").
- **Trigger Probability**
The fault is applied probabilistically based on a trigger probability between
0.0 and 1.0 (default 1.0). A value less than 1.0 means that only a fraction of
the requests will trigger the error response, enabling the simulation of
intermittent errors rather than constant failure.
- **Impact on Communication**
This fault terminates the normal request–response cycle by immediately
returning the error response. It is useful in tests where you need to verify
that error handling or failover mechanisms in your client application are
functioning correctly.
# CLI Reference
This document provides an overview of the CLI. The CLI is organized into a
single command with grouped parameters, allowing you to configure and run
the proxy with various network fault simulations, execute test scenarios
defined in a file or launch a local demo server.
---
## Commands
### `run`
Run the proxy with fault injection enabled. This command applies the specified
network faults to TCP streams and HTTP requests.
It has two subcommands to specifically explore LLM and database use-cases.
### `inject`
Inject the fault proxy into your platform resources, such as Kubernetes.
### `scenario`
Execute a predefined fault injection scenario. This command includes additional
subcommands for building scenarios from OpenAPI specification.
### `agent`
Run a MCP Server and tools.
Analyze scenario results and suggest code changes using LLM.
### `demo`
Run a simple demo server for learning purposes, with various fault simulation
options available.
---
## Global Options
These options apply across all commands.
- **`--log-file `**
HTTP status code to return (e.g., 500, 503).
_Default:_ `500`
- **`--http-response-body `**
Optional response body to return.
_Default:_ (none)
- **`--http-response-trigger-probability `**
Probability (0.0 to 1.0) to trigger the HTTP response fault.
_Default:_ `1.0` (always trigger when enabled)
- **`--http-response-sched `**
[Intervals scheduling](./schedule-intervals-syntax.md) when to apply the fault (require `--duration` whhen using relative schedule).
**Example:** `--http-response-sched "start:30s,duration:60s"`
**Example:** `--http-response-sched "start:5%,duration:40%"` (requires `--duration`)
---
### Blackhole Options
Learn more about the [Blackhole fault](./builtin-faults.md#blackhole).
- **`--with-blackhole`**
Enable blackhole fault injection.
_Default:_ Disabled
- **`--blackhole-direction `**
Direction to apply the blackhole fault. Options: `ingress`, `egress`, `both`
_Default:_ `ingress`
- **`--blackhole-sched `**
[Intervals scheduling](./schedule-intervals-syntax.md) when to apply the fault (require `--duration` when using relative schedule).
**Example:** `--blackhole-sched "start:30s,duration:60s"`
**Example:** `--blackhole-sched "start:5%,duration:40%"` (requires `--duration`)
---
### `llm` Subcommand Options
Specific faults to target your LLM.
**** Which LLM provider to target, one of `openai`, `gemini`,
`open-router` and `ollama`
- **`--endpoint`**
The base URL of the targeted LLM provider. Usually, you do not need to set
this value as the right base url will be set for each provider.
- **`--case`**
Which scenarios to run. Possible values `slow-stream`, `prompt-scramble`,
`token-drop`, `inject-bias`, `truncate-response`, `http-error`
- **`--probability`**
Fault injection probability between 0.0 (never) to 1.0 (always)
_Default:_ `1.0`
Each case has its own parameters:
When `--case` is `slow-stream`.
- **`--slow-stream-mean-delay`**
Delay in miliseconds to slow the stream by.
_Default:_ `300`
When `--case` is `token-drop`.
No extra parameters.
When `--case` is `prompt-scramble`.
- **`--scramble-pattern`**
Optional regex pattern to scramble in prompt.
- **`--scramble-with`**
Optional substitute text for scramble (must be set when `--scramble-pattern`
is set)
- **`--instruction`**
Optional instruction/System prompt to set on the request.
When `--case` is `inject-bias`.
- **`--bias-pattern`**
Regex pattern for bias.
- **`--bias-replacement`**
Substitute text for bias.
- **`--instruction`**
Optional instruction/System prompt to set on the response chunks.
When `--case` is `http-error`.
No extra parameters.
### Usage Examples
#### Running the Proxy with Multiple Faults
```bash
fault run \
--proxy-address "127.0.0.1:3180" \
--with-latency --latency-mean 120.0 --latency-stddev 30.0 \
--with-bandwidth --bandwidth-rate 2000 --bandwidth-unit KBps
```
#### Adding instructions to a LLM call
```bash
fault run llm openai --instruction "Respond in French"
```
## `injection` Command Options
Inject fault into your platform resources.
### AWS Options
- **`--region `**
Region of the target service._
**Example:** `--project europe-west1`
- **`--cluster `**
_ECS Cluster hosting of the target service._
**Example:** `--cluster my-cluster-56x7xhg`
- **`--service `**
_Target ECS service._
**Example:** `--service web`
- **`--image `**
_Container image to inject, its entrypoint must be the `fault` binary._
_Default:_ `ghcr.io/fault-project/fault-cli:latest`
**Example:** `--image myimage:latest`
- **`--duration `**
_Duration for which the fault is injected. If unset, `fault` waits for the user input. Follows [this format](https://docs.rs/parse_duration/latest/parse_duration/#syntax)_
**Example:** `--duration 30s`
In addition, this subcommand supports all the fault options of the `run`
command.
### GCP Options
- **`--project `**
_Project hosting of the target service._
**Example:** `--project myproject-56x7xhg`
- **`--region `**
Region of the target service._
**Example:** `--project europe-west1`
- **`--service `**
_Target service._
**Example:** `--service web`
- **`--percent `**
Traffic volume to the revision._
_Default:_ `100`
**Example:** `--project europe-west1`
- **`--image `**
_Container image to inject, its entrypoint must be the `fault` binary. The image must live inside GCP's artifact registry and accessible for this region._
**Example:** `--image myimage:latest`
- **`--duration `**
_Duration for which the fault is injected. If unset, `fault` waits for the user input. Follows [this format](https://docs.rs/parse_duration/latest/parse_duration/#syntax)_
**Example:** `--duration 30s`
In addition, this subcommand supports all the fault options of the `run`
command.
### Kubernetes Options
- **`--ns `**
_Namespace of the target service._
_Default:_ `default`
**Example:** `--ns myapp`
- **`--service `**
_Target service._
**Example:** `--service web`
- **`--image `**
_Container image to inject, its entrypoint must be the `fault` binary._
_Default:_ `ghcr.io/fault-project/fault-cli:latest`
**Example:** `--image myimage:latest`
- **`--duration `**
_Duration for which the fault is injected. If unset, `fault` waits for the user input. Follows [this format](https://docs.rs/parse_duration/latest/parse_duration/#syntax)_
**Example:** `--duration 30s`
In addition, this subcommand supports all the fault options of the `run`
command.
## `scenario` Command Options
A fault scenario is a file containing test scenarios to execute automatically
by fault generating report and result files for further analysis.
### Proxy Configuration Options
- **`--proxy-address `**
_Listening address for the proxy server._
_Default:_ `127.0.0.1:3180`
**Example:** `--proxy-address 192.168.12.45:8090`
### Run Options
- **`--scenario `**
_Path to a YAML scenario file._
**Example:** `--scenario ./scenario.yaml`
- **`--report `**
_Path to a file where to save the final repor._
**Example:** `--scenario ./report.yaml`
### Generate Options
- **`--scenario `**
_Path to a YAML scenario file or directory. If you pass a directory, the scenarios will be split in individual files per endpoint._
**Example:** `--scenario ./scenario.yaml`
- **`--spec-file `**
_Path to an OpenAPI specification file (or use `--spec-url`)._
**Example:** `--spec-file ./openapi.json`
- **`--spec-url `**
URL to an OpenAPI specification file (or use `--spec-file`)._
**Example:** `--spec-url http://localhost/openapi.json`
## `agent` Command Options
A fault agent is an AI agent using LLM to analyze code and scenario results to
help you make appropriate changes.
### Common Options
These options define the LLm parameters of the agent.
!!! note
fault supports [Gemini](../how-to/agent/llm-configuration.md#gemini),
[OpenAI](../how-to/agent/llm-configuration.md#openai),
[ollama](../how-to/agent/llm-configuration.md#ollama) and
[OpenRouter](../how-to/agent/llm-configuration.md#openrouter).
- **`--llm-client `**
_Select the LLM client to use._
_Default:_ `open-ai`
- **`--llm-prompt-reasoning-model `**
_Reasoning model to use._
_Default:_ `o4-mini`
- **`--llm-embed-model `**
_Embedding model to use._
_Default:_ `text-embedding-3-small`
### Code Review Options
Ask fault to review your source code.
- **`--report `**
_Path to the file where the report is saved._
_Default:_ `code-review-report.md`
- **`--advices-report `**
_Path to report generated by the `scenario-review` command (optional)._
_Default:_ `scenario-review-report.md`
- **`--results `**
_Path to the scenario results JSON file._
_Default:_ `results.json`
- **`--index `**
_Path to the DuckDB index to use for source code indexing._
_Default:_ `/tmp/index.db`
- **`--source-dir `**
_Path to the top-level source-code directory to bring more context._
- **`--source-lang `**
_Language of the source code: python, rust, java...._
### Scenario Review Options
Ask fault to review a scenario run's results.
- **`--report `**
_Path to the file where the report is saved._
_Default:_ `scenario-review-report.md`
- **`--results `**
_Path to the scenario results JSON file._
_Default:_ `results.json`
- **`--role `**
_Role to generate the review with: `developer` or `sre`._
_Default:_ `developer`
## `demo` Command Options
A simple demo server listening for HTTP requests.
### Demo Options
- **`--address `**
_IP address to bind the the demo server to._
_Default:_ `127.0.0.1`
**Example:** `--address 192.168.2.34`
- **`--port `**
_Port to bind to._
_Default:_ `7070`
**Example:** `--port 8989`
# Environment Variables
fault is configured through its CLI arguments. However, in some cases, it may
be simpler to populate these options via environment variables.
## Common Variables
| **Name** | **Default Value** | **Explanation** |
|----------------------------------|---------------------|--------------------------------------------------------------------------------------------------|
| `FAULT_LOG_FILE` | (none) | Path to a file where to write fault logs |
| `FAULT_WITH_STDOUT_LOGGING` | `false` | Whether to enable logging to stdout |
| `FAULT_LOG_LEVEL` | `info,tower_http=debug` | Level respecting tracing subscriber [env filter](https://docs.rs/tracing-subscriber/latest/tracing_subscriber/filter/struct.EnvFilter.html#directives) directives |
## Observability Variables
| **Name** | **Default Value** | **Explanation** |
|----------------------------------|---------------------|--------------------------------------------------------------------------------------------------|
| `FAULT_WITH_OTEL` | `false` | Whether to enable Open Telemetry tracing and metrics |
## `run` Command Variables
| **Name** | **Default Value** | **Explanation** |
|----------------------------------|---------------------|--------------------------------------------------------------------------------------------------|
| `FAULT_PROXY_NO_UI` | (none) | Disables the terminal UI and make the output fully silent. |
| `FAULT_PROXY_ADDRESS` | `127.0.0.1:3180` | The address on which the proxy server listens. |
| `FAULT_DISABLE_HTTP_PROXY` | `false` | Disables the HTTP proxies. |
| `FAULT_PROXY_DURATION` | (none) | Defines [how long](https://docs.rs/parse_duration/latest/parse_duration/#syntax) the proxy runs for. |
| `FAULT_ENABLE_STEALTH` | `false` | Whether stealth mode (using eBPF) is enabled. |
| `FAULT_EBPF_PROCESS_NAME` | (none) | The name of a process to intercept traffic from (used when stealth mode is enabled). |
| `FAULT_EBPF_PROGRAMS_DIR` | `"$HOME/cargo/bin"` | The directory where eBPF programs for fault can be found (used when stealth mode is enabled). |
| `FAULT_EBPF_PROXY_IP` | (none) | The address to use by the eBPF proxy. If unset, uses the same as the default proxy address. |
| `FAULT_EBPF_PROXY_PORT` | (none) | The port the eBPF proxy is bound to. By default uses a random port. |
| `FAULT_EBPF_PROXY_IFACE` | (none) | The interface to attach the eBPF programs to. Uses the interface of the proxy IP by default. |
| `FAULT_GRPC_PLUGINS` | (none) | Comma-separated list of gRPC plugin addresses. |
| `FAULT_UPSTREAMS` | (none) | Comma-separated list of upstream hostnames to proxy. |
| `FAULT_WITH_LATENCY` | `false` | Whether a latency fault is enabled. |
| `FAULT_LATENCY_PER_READ_WRITE` | `false` | Whether latency should be applied on a per read/write operation or once. |
| `FAULT_LATENCY_DISTRIBUTION` | `normal` | The statistical distribution used. |
| `FAULT_LATENCY_SIDE` | `server` | The side which will be impacted by the fault. |
| `FAULT_LATENCY_DIRECTION` | `ingress` | The direction which will be impacted by the fault. |
| `FAULT_LATENCY_MEAN` | (none) | Mean latency in milliseconds for latency fault injection. |
| `FAULT_LATENCY_STANDARD_DEVIATION` | (none) | Standard deviation of latency in milliseconds. |
| `FAULT_LATENCY_SHAPE` | (none) | Distribution shape when using pareto or pareto normal. |
| `FAULT_LATENCY_SCALE` | (none) | Distribution scale when using pareto or pareto normal. |
| `FAULT_LATENCY_MIN` | (none) | Minimum latency when using a uniform distribution. |
| `FAULT_LATENCY_MAX` | (none) | Maximum latency when using a uniform distribution. |
| `FAULT_LATENCY_SCHED` | (none) | Scheduling of the latency fault. |
| `FAULT_WITH_BANDWIDTH` | `false` | Whether a bandwidth fault is enabled. |
| `FAULT_BANDWIDTH_DIRECTION` | `ingress` | The direction which will be impacted by the fault. |
| `FAULT_BANDWIDTH_RATE` | `1000` | Rate to impose on traffic. |
| `FAULT_BANDWIDTH_UNIT` | `bps` | Unit of the rate. |
| `FAULT_BANDWIDTH_SCHED` | (none) | Scheduling of the bandwidth fault. |
| `FAULT_WITH_JITTER` | `false` | Whether a jitter fault is enabled. |
| `FAULT_JITTER_AMPLITUDE` | `20.0` | Maximum jitter delay in milliseconds for jitter fault injection. |
| `FAULT_JITTER_FREQ` | `5.0` | Frequency (in Hertz) of jitter application. |
| `FAULT_JITTER_SCHED` | (none) | Scheduling of the jitter fault. |
| `FAULT_WITH_PACKET_LOSS` | `false` | Whether a packet-loss fault is enabled. |
| `FAULT_PACKET_LOSS_SIDE` | `server` | The side which will be impacted by the fault. |
| `FAULT_PACKET_LOSS_DIRECTION` | `ingress` | The direction which will be impacted by the fault. |
| `FAULT_PACKET_LOSS_SCHED` | (none) | Scheduling of the packet-loss fault. |
| `FAULT_WITH_HTTP_FAULT` | `false` | Whether a http fault fault is enabled. |
| `FAULT_HTTP_FAULT_STATUS` | `500` | HTTP status code to return when the HTTP response fault is triggered. |
| `FAULT_HTTP_FAULT_PROBABILITY` | `1.0` | Probability to apply the fault on a given HTTP exchange. |
| `FAULT_HTTP_FAULT_SCHED` | (none) | Scheduling of the HTTP response fault. |
| `FAULT_WITH_DNS` | `false` | Whether a dns fault is enabled. |
| `FAULT_DNS_PROBABILITY` | `0.5` | Probability (0–100) to trigger a DNS fault. |
| `FAULT_DNS_SCHED` | (none) | Scheduling of the dns fault. |
### `run llm` Command Variables
| **Name** | **Default Value** | **Explanation** |
|----------------------------------|---------------------|--------------------------------------------------------------------------------------------------|
| `FAULT_LLM_ENDPOINT` | (none) | Base URL of the target LLM provider. |
| `FAULT_LLM_PROBABILITY` | `1.0` | Probability which will trigger the fault injection (0 means never and 1 means always). |
| `FAULT_LLM_SLOW_STREAM_MEAN_DELAY` | `300` | Latency to apply to the LLM response. |
| `FAULT_LLM_SCRAMBLE_PATTERN` | (none) | Regex pattern to look for into the request. |
| `FAULT_LLM_SCRAMBLE_WITH` | (none) | Replacement string when the pattern matches. |
| `FAULT_LLM_INSTRUCTION` | (none) | Instruction to inject into the LLM requests/responses as a system prompt. |
| `FAULT_LLM_BIAS_PATTERN` | (none) | Regex pattern to look for into the response. |
| `FAULT_LLM_BIAS_REPLACEMENT` | (none) | Replacement string when the pattern matches. |
## `injection` Command Variables
### `aws` Subcommand Variables
| **Name** | **Default Value** | **Explanation** |
|----------------------------------|---------------------|--------------------------------------------------------------------------------------------------|
| `FAULT_INJECTION_AWS_ECS_CLUSTER` | (none) | ECS Cluster hosting the service. |
| `FAULT_INJECTION_AWS_REGION` | (none) | Regions where the service lives. |
| `FAULT_INJECTION_AWS_ECS_SERVICE` | (none) | Target ECS service name to inject faults into. |
| `FAULT_INJECTION_AWS_IMAGE` | (none) | Container image to run as the sidecar of the service. |
| `FAULT_INJECTION_GCP_DURATION` | (none) | Duration for which the fault is applied. Follows [this format](https://docs.rs/parse_duration/latest/parse_duration/#syntax). |
In addition, this subcommand supports the same proxy fault options as the
`run` command.
### `gcp` Subcommand Variables
| **Name** | **Default Value** | **Explanation** |
|----------------------------------|---------------------|--------------------------------------------------------------------------------------------------|
| `FAULT_INJECTION_GCP_PROJECT` | (none) | Project hosting the service. |
| `FAULT_INJECTION_GCP_REGION` | (none) | Regions where the service lives. |
| `FAULT_INJECTION_GCP_TRAFFIC_PERCENT` | 100 | Traffic percentage sent through the created revision. |
| `FAULT_INJECTION_GCP_SERVICE` | (none) | Target CloudRun service name to inject faults into. |
| `FAULT_INJECTION_GCP_IMAGE` | (none) | Container image to run as the sidecar of the service. |
| `FAULT_INJECTION_GCP_DURATION` | (none) | Duration for which the fault is applied. Follows [this format](https://docs.rs/parse_duration/latest/parse_duration/#syntax). |
In addition, this subcommand supports the same proxy fault options as the
`run` command.
### `kubernetes` Subcommand Variables
| **Name** | **Default Value** | **Explanation** |
|----------------------------------|---------------------|--------------------------------------------------------------------------------------------------|
| `FAULT_INJECTION_K8S_NS` | `default` | Namespace of the target service. |
| `FAULT_INJECTION_K8S_SERVICE` | (none) | Target service to inject faults into. |
| `FAULT_INJECTION_K8S_IMAGE` | `ghcr.io/fault-project/fault-cli:latest` | Container image to run in the cluster. Its entrypoint must be the `fault` binary. |
| `FAULT_INJECTION_K8S_DURATION` | (none) | Duration for which the fault is applied. Follows [this format](https://docs.rs/parse_duration/latest/parse_duration/#syntax). |
In addition, this subcommand supports the same proxy fault options as the
`run` command.
## `scenario` Command Variables
| **Name** | **Default Value** | **Explanation** |
|----------------------------------|---------------------|--------------------------------------------------------------------------------------------------|
| `FAULT_SCENARIO_REPORT_PATH` | (none) | The file path to a scenario file or a directory path to a folder containing scenario files. |
| `FAULT_SCENARIO_PROXY_ADDR` | `127.0.0.1:3180` | Address of the proxy the secanrio command will run during the tests |
## `agent` Command Variables
| **Name** | **Default Value** | **Explanation** |
|----------------------------------|---------------------|--------------------------------------------------------------------------------------------------|
| `FAULT_AGENT_CLIENT` | `open-ai` | The LLM client to use (amongst `gemini`, `open-ai`, `open-router` or `ollama`). |
| `LLM_PROMPT_REASONING_MODEL` | `o4-mini` | The LLM reasoning model to use. |
| `FAULT_AGENT_EMBED_MODEL` | `text-embedding-3-small` | The LLM embedding model to use. |
### `scenario-review` Subcommand Variables
| **Name** | **Default Value** | **Explanation** |
|----------------------------------|---------------------|---------------------|
| `FAULT_SCENARIO_RESULTS_PATH` | (none) | Path to the results file from the `scenario run` command. |
| `FAULT_AGENT_SCENARIO_REVIEW_REPORT_FILE` | `scenario-analysis-report.md` | Path to the file where to save the generated report. |
| `FAULT_AGENT_ADVICE_ROLE` | `developer` | Role to generate the report from, one of `developer` or `sre`. |
### `code-review` Subcommand Variables
| **Name** | **Default Value** | **Explanation** |
|----------------------------------|---------------------|---------------------|
| `FAULT_SCENARIO_RESULTS_PATH` | (none) | Path to the results file from the `scenario run` command. |
| `FAULT_AGENT_CODE_REVIEW_REPORT_FILE` | `code-review-report.md` | Path to the file where to save the generated report. |
| `FAULT_AGENT_CODE_REVIEW_SOURCE_DIR` | (none) | Directory where the source code is located |
| `FAULT_AGENT_CODE_REVIEW_SOURCE_LANGUAGE` | (none) | Language of the source code: `python`, `go`, `rust`, `java`, `typescript`, `javascript`, `elixir` |
| `FAULT_AGENT_CODE_REVIEW_SOURCE_INDEX_PATH` | `/tmp/index.db` | Path of the [DuckDB](https://duckdb.org/) vector database where storing the index |
| `FAULT_AGENT_SCENARIO_REVIEW_REPORT_FILE` | `scenario-analysis-report.md` | Path of the report generated by `agent scenario-review` |
## `demo` Command Variables
| **Name** | **Default Value** | **Explanation** |
|----------------------------------|---------------------|--------------------------------------------------------------------------------------------------|
| `FAULT_DEMO_ADDR` | `127.0.0.1` | IP address to bind the server to. |
| `FAULT_DEMO_PORT` | `7070` | Port to bind the server to. |
# Injecting fault Into Your Platform
This page references the information about how fault injects its resources
into the platform it supports.
## Google Cloud Platform
fault may run on Google Cloud Platform by
hooking into a Cloud Run service.
When initializing, fault creates a new revision of the
service and injects a sidecar container into it. The container runs the
`fault` cli.
The new sidecar container also exposes a port between `50000` and `55000`.
This means that traffic will now be sent to the fault
container which will reroute to `127.0.0.1:` where the
`` is the original port exposed by the Cloud Run service.
On rollback, a new revision is created with the previous specification of the
service.
```mermaid
sequenceDiagram
autonumber
fault (local)->>CloudRun Service: Fetch
fault (local)->>CloudRun Service: Add fault's container as a sidecar, expose a random port between 50000 and 55000 as the public port of the service.
CloudRun Service->>fault CloudRun Container: Starts container and set traffic shapping on new revision
loop fault proxy
fault CloudRun Container->>CloudRun Application Container: Route traffic via fault on `127.0.0.1:`
loop fault injection
fault CloudRun Container->>fault CloudRun Container: Apply faults
end
end
```
fault uses the default GCPO authentication mechanism to
connect to the project.
The roles for that user needs at least the following permissions:
- run.services.get
- run.services.list
- run.services.update
You should be fine with using the [roles/run.developer](https://cloud.google.com/run/docs/reference/iam/roles#run.developer) role.
## Kubernetes
fault may run on Kubernetes by creating the following resources:
* a job (CronJob are not supported yet)
* a service
* a dedicated service account
* a config map that holds the environment variables used to configure the proxy
```mermaid
sequenceDiagram
autonumber
fault (local)->>Service Account: Create
fault (local)->>Config Map: Create with fault's proxy environment variables
fault (local)->>Target Service: Fetch target service's selectors and ports
fault (local)->>Target Service: Replace target service selectors to match new fault's pod
fault (local)->>fault Service: Create new service with target service's selectors and ports but listening on port 3180
fault (local)->>Job: Create to manage fault's pod, with proxy sending traffic to new service's address
Job->>fault Pod: Schedule fault's pod with config map attached
fault Pod->>Service Account: Uses
fault Pod->>Config Map: Loads
Target Service->>fault Pod: Matches
loop fault proxy
fault (local)->>Target Service: Starts scenario
Target Service->>fault Pod: Route traffic via fault
loop fault injection
fault Pod->>fault Pod: Apply faults
end
fault Pod->>fault Service: Forwards
fault Service->>Target Pods: forward traffic to final endpoints
Target Pods->>fault (local): Sends response back after faults applied
end
```
!!! note
Once a scenario completes, fault rollbacks the resources to their
original state.
fault uses the default Kubernetes authentication mechanism to connect
to the cluster: `~/.kube/config`, `KUBECONFIG`...
The authorizations for that user needs at least the following roles:
```yaml
apiVersion: rbac.authorization.k8s.io/v1
kind: Role
metadata:
name: fault
rules:
# ServiceAccounts (create/delete)
- apiGroups: [""]
resources:
- serviceaccounts
verbs:
- create
- delete
- get
# ConfigMaps (create/delete/get)
- apiGroups: [""]
resources:
- configmaps
verbs:
- create
- delete
- get
# Services (get/patch/delete)
- apiGroups: [""]
resources:
- services
verbs:
- get
- patch
- delete
# Jobs (create/delete/get/list)
- apiGroups:
- batch
resources:
- jobs
verbs:
- create
- delete
- get
- list
# Pods (list/get)
- apiGroups: [""]
resources:
- pods
verbs:
- get
- list
- watch
```
# Proxy Mapping
HTTP is one of the most common protocol used to communicate between services
or from the external world in your system. It stands to reason to widely focus
on that interface to build greater reliability. It is so ubiquitous that fault
supports it by default.
However, we believe there is also great value to explore the impact of network
issues on non-HTTP communication. For instance, how does your application deal
with latency when it access the database, its cache server, etc.
This is what fault supports through TCP proxying.
## What is a fault TCP proxy?
A TCP proxy is a fault proxy that listens on a given port for incoming
connections over the TCP protocol. When such a connection is made, the proxy
also connects to a remote endpoint. During the life of these connections, any
traffic received by the proxy is copied as-is and sent to the remote host.
The proxy applies any configured network faults on the stream.
### Flow
``` mermaid
sequenceDiagram
autonumber
Client->>Proxy: Connect
Proxy->>Remote: Connect
Note left of Remote: Potentially encrypted over TLS
loop Stream
Client->>Remote: Stream data from client to remote via proxy. Apply all network faults
end
Client->>Proxy: Disonnect
Proxy->>Remote: Disconnect
```
### Proxy Mapping
To stitch a client to its remote endpoint, you need a proxy mapping between
a local address for the proxy and a remote host. Once you have configured this
mapping, your client should use the address of the proxy instead of the
actual remote host.
### Encryption
When it comes to encryption, fault supports a simple use case for now. If the
remote endpoint requires encryption over TLS, you can configure the mapping
accordingly and the proxy will establish a secured connection with the remote
host.
However, for now, the flow between the client and the proxy is in clear text.
A future release will let you setup the proxy to expect a secured connection
from the client.
## Grammar
The proxy mapping grammar is a tiny DSL. Below is its EBNF grammar:
```ebnf
config = left "=" right
left = port
right = hostport | proto_url
hostport = host ":" port
proto_url = protocol "://" host opt_port
opt_port = ":" port | /* empty */
protocol = "http" | "https" | "psql" | "psqls" | "tls"
port = digit { digit }
host = char { char }
(* a host is any nonempty string of characters that is not "=" or ":" *)
digit = "0" | "1" | "2" | "3" | "4" | "5" | "6" | "7" | "8" | "9"
char = any character except "=" and ":"
```
!!! note "The protocol is optional"
When you map to a remote endpoint, you may be explicit about the L7 protocol
that will transit. This is entirely optional and, for now, fault does not
interpret it beyond deciding if the communication between the proxy
and the remote host should be encrypted.
In a future version, fault might use this information for more logic.
## Examples
Here are a few examples:
**Send traffic to Google via a local proxy on port 9090**
```bash
--proxy "9090=https://www.google.com"
```
**Send traffic to PostgreSQL via a local proxy on port 35432**
```bash
--proxy "35432=psql://my-db.default.svc:5432"
```
# Scenario File Format
## Scenario Overview
A fault scenario file is a structured document that defines a suite of tests
designed to simulate adverse network conditions and assess your application's
resilience.
At the top level, a scenario file contains metadata that provides context for
the entire test suite. This is followed by a collection of individual test
cases, each of which is known as a scenario item.
Each scenario item is composed of three primary components:
!!! info
You can generate scenarios using the
[fault scenario generate](../how-to/scenarios/generate.md) command.
**Call:**
This section describes the HTTP request that will be executed during the test.
It specifies essential details such as the HTTP method
(for example, GET or POST), the target URL, and any headers or body content that
are required. Essentially, it outlines the action that triggers the fault
injection.
!!! question "Only HTTP?"
fault currently supports HTTP-based scenarios. In a future version, we may
try to support more protocols.
**Context:**
The context defines the environment in which the test runs. It lists the
upstream endpoints that will be affected by fault injection and specifies the
type of faults to simulate. Faults can include network latency, packet loss,
bandwidth restrictions, jitter, blackhole anomalies, or HTTP errors.
Additionally, an optional strategy can be included to repeat or vary the test
conditions systematically.
**Expectation:**
This component sets the criteria for a successful test. It defines what outcomes
are acceptable by specifying expected HTTP status codes and performance metrics
like maximum response times. Alternatively, expectations can also be Servie
Level Objectives to verify. By clearly stating these expectations, the scenario
file provides a benchmark against which the test results can be measured.
The structured approach of a scenario file not only helps maintain consistency
across tests but also simplifies troubleshooting and iterative refinement. For
detailed information on individual fault parameters, refer to the relevant
definitions. This ensures that each test case is both precise and aligned with
your reliability objectives.
!!! example "A few scenarios to get a taste..."
=== "Basic scenario"
```yaml
title: Single high-latency spike (client ingress)
description: A single 800ms spike simulates jitter buffer underrun / GC pause on client network stack.
items:
- call:
method: GET
url: http://localhost:9090/
context:
upstreams:
- http://localhost:9090/
faults:
- type: latency
side: client
mean: 800.0
stddev: 100.0
direction: ingress
expect:
status: 200
```
=== "Load test scenario with SLO"
```yaml
title: 512 KBps bandwidth cap
description: Models throttled 3G link; validates handling of large payloads.
items:
- call:
method: POST
url: http://localhost:9090/users/
headers:
content-type: application/json
body: '{"name": "jane", "password": "boom"}'
meta:
operation_id: create_user_users__post
context:
upstreams:
- http://localhost:9090
faults:
- type: bandwidth
rate: 512
unit: KBps
direction: ingress
strategy:
mode: load
duration: 15s
clients: 2
rps: 1
slo:
- slo_type: latency
title: P95 < 300ms
objective: 95.0
threshold: 300.0
- slo_type: error
title: P99 < 1% errors
objective: 99.0
threshold: 1.0
expect:
status: 200
```
## Scenario Structure
### HTTP `call`
A file may contain many scenarios. They can be grouped however you need to
make sense of the results. For instance, one approach is to group them by
endpoint URL.
A scenario is made of at least one `call`. A `call` describes an endpoint, a
fault context and optionally a block to verify expectations.
The `call` thus declares the HTTP configuration. The endpoint URL, a valid
HTTP method. Optional headers and body may also be provided.
Note that the a `call` block also supports a `meta` structure that allows you
to declare the `operation_id` (from [OpenAPI](https://swagger.io/docs/specification/v3_0/paths-and-operations/#operationid). This is a piece of information used by
the fault agent when analyzing the scenario results.
### fault `context`
The `context` gathers the configuration for fault. These are the typical
information fault's CLI uses already so you should be familiar with them
hopefully.
A list of `upstreams` servers which should be impacted by the network faults.
A sequence of `faults` applied during the run. Finally, a `strategy` block
describing how to run the scenario.
* No `strategy` block means a asingle shot call (e.g. a single HTTP request)
* A strategy with `mode` set to `repeat`. The scenario will be executed N
iterations
* A strategy with `mode` set to `load`. The scenario will be executed for
a duration with a given traffic.
Finally, the `context` may take a `slo` block that describes a list of
service level objectives (SLO). These SLOs are not meant to exist. They allow
you to declare what they might be for that endpoint (actually, they can
represent real SLOs but fault doesn't link to them). These fake SLOs are useful
when running a `strategy` of type `load` because the report fault generates
will give you feedback about them in the context of the scenario.
#### Running On a Platform
The default behavior is to execute scenarios locally in the current
`fault` process. Scenarios may be run on a different target. fault
supports the following platforms:
* Kubernetes
* GCP (coming soon)
* AWS (coming soon)
To execute on a remote platform, use the `runs_on` property. When found,
fault creates the necessary resources on the platform and launch a dedicated
fault instance to actually perform the injection of network faults.
##### Kubernetes
Here is an example to run a scenario as a Kubernetes job:
```yaml
context:
runs_on:
platform: kubernetes
service: # (1)!
ns: default # (2)!
image: "ghcr.io/fault-project/fault-cli:latest" # (3)!
```
1. The service to inject fault into
2. The namespace where this service is located
3. (optional) The default image used to launch the pod's fault. If you create your own image, make sure that `fault` remains the entrypoint
Read [about how fault injects itself into a Kubernetes cluster](./injection.md#kubernetes).
#### A word about SLO
fault advocates for practicing reliability and resilience as early and often
as possible. Both require constant attention to make an impact. To achieve this,
a team may be looking at implementing Site Reliability Engineering or SRE.
!!! question "What is SRE?"
If you are interested in learning more about SRE, please check out the
excellent [documentation](https://sre.google/) put out by Google on the
topic.
One the tool coming from SRE is called
[Service Level Objective](https://sre.google/sre-book/service-level-objectives/)
or {==SLO==}. These provide a mechanism to decide how close a service is to
requiring attention. By defining a level of health for a service, a team has a
new capability called an error budget. Essentially, it's a room for a team to
bring change safely.
So, where does fault come into this?
In the context of a fault scenario, we can use SLO to help us figure out
if a particular combination of network faults might impact the health of our
service, and the extent of this impact.
!!! example "fault SLO definition"
SLO are declared as part of the scenario's `context` and is a sequence of
slo objects. For instance:
```yaml
slo:
- type: latency
title: "P95 Latency < 110ms"
objective: 95
threshold: 110.0
- type: latency
title: "P99 Latency < 200ms"
objective: 99
threshold: 200.0
- type: error
title: "P98 Error Rate < 1%"
objective: 98
threshold: 1
```
These SLO do not need to exist per-se. In other words, they aren't tied to
any APM or monitoring tool. They simply express health service expectations.
!!! note
fault supports two types of SLO: `latency` and `error`.
When a scenario runs, fault computes then a variety of latency and error
percentiles (p25, p50, p75, p95 and p99) to compare them with these SLO.
!!! example "fault SLO reporting"
For instance, fault may generate the following report:
| Latency Percentile | Latency (ms) | Num. Requests (% of total) |
|------------|--------------|-----------|
| p25 | 394.95 | 16 (26.2%) |
| p50 | 443.50 | 31 (50.8%) |
| p75 | 548.39 | 47 (77.0%) |
| p95 | 607.70 | 59 (96.7%) |
| p99 | 636.84 | 61 (100.0%) |
| SLO | Pass? | Objective | Margin | Num. Requests Over Threshold (% of total) |
|-----------|-------|-----------|--------|--------------------------|
| P95 < 300ms | ❌ | 95% < 300ms | Above by 307.7ms | 55 (90.2%) |
| P99 < 1% errors | ✅ | 99% < 1% | Below by 1.0 | 0 (0.0%) |
fault is well aware that the window of the scenario is short. fault takes
the view that even from such a small period of time, we can extrapolate valuable
information.
We believe fault `slo` bridges SRE to developers. SLO is a simple language
which makes it explicit what a healthy service performs.
!!! info
fault is not an APM/monitoring tool, it doesn't aim at becoming one. A slo
in the context of fault is only a language to help developers see the world
as their operations expect it to be.
### An `expect` block
The `expect` block defines how you want to verify the results from the `call`.
* `status` to match against the `call` response code (must be a valid HTTP code)
* `response_time_under` defines the ceiling of the `call` response's time
Note that, these two are ignored when `strategy` is set to `load`.
## Scenario Flow
fault scenarios are self-contained and standalone in their execution. When
a scenario is executed, the proxy is configured with the appropriate fault
settings. Next fault starts sending network traffic to the
scenario's target URL following the configured strategy. Then, fault
compares results with the optional expectations or SLOs.
Once all the scenario items have been executed, fault makes a final
report and writes to a markdown document.
## OpenAPI Support
fault supports OpenAPI v3 (v3.0.x and v3.1.x). It may generate scenarios
from an OpenAPI specification to rapidly bootstrap your catalog of scenarios.
fault scans an OpenAPI specification and gather the following information:
* the endpoint `url`
* the HTTP `method`
* if the method is either `POST` or `PUT`, it also scans the body definition.
When this is a typical structured body, it creates a default payload as well.
Then fault generates a variety of scenarios to create a solid baseline of
scenarios against each endpoint.
The default behavior from fault is to create the following scenarios:
* **Single high-latency spike**: single short client ingress
* **Stair-step latency growth (5 x 100 ms)**: gradualy increase latency
* **Periodic 150-250 ms latency pulses during load**: load test 3 clients/2 rps
* **5% packet loss for 4s**: single shot egress
* **High jitter (±80ms @ 8Hz)**: single shot ingress
* **512 KBps bandwidth cap**: load test 2 clients/1 rps
* **Random 500 errors (5% of calls)**: load test 5 clients/4 rps
* **Full black-hole for 1s**: load test 2 clients/3 rps
!!! tip "Make it your own"
A future version of fault should allow you to bring your own scenario
templates.
!!! tip "More coverage in the future"
Right now, fault generates scenarios against the endpoints themselves,
a future release will also generate them for downstream dependencies.
## Example
The following example demonstrates a scenario file with many tests and their
expectations.
```yaml title="scenario.yaml"
title: Single high-latency spike (client ingress)
description: A single 800ms spike simulates jitter buffer underrun / GC pause on client network stack.
items:
- call:
method: GET
url: http://localhost:9090/
meta:
operation_id: read_root__get
context:
upstreams:
- http://localhost:9090/
faults:
- type: latency
side: client
mean: 800.0
stddev: 100.0
direction: ingress
strategy: null
expect:
status: 200
---
title: Stair-step latency growth (5 x 100 ms)
description: Latency increases 100 ms per call; emulate slow congestion build-up or head-of-line blocking.
items:
- call:
method: GET
url: http://localhost:9090/
meta:
operation_id: read_root__get
context:
upstreams:
- http://localhost:9090/
faults:
- type: latency
side: client
mean: 100.0
stddev: 30.0
direction: ingress
strategy:
mode: repeat
step: 100.0
count: 5
add_baseline_call: true
expect:
status: 200
---
title: Periodic 150-250 ms latency pulses during load
description: Three latency bursts at 10-40-70% of a 10s window; good for P95 drift tracking.
items:
- call:
method: GET
url: http://localhost:9090/
meta:
operation_id: read_root__get
context:
upstreams:
- http://localhost:9090/
faults:
- type: latency
mean: 150.0
period: start:10%,duration:15%
- type: latency
mean: 250.0
period: start:40%,duration:15%
- type: latency
mean: 150.0
period: start:70%,duration:15%
strategy:
mode: load
duration: 10s
clients: 3
rps: 2
slo:
- slo_type: latency
title: P95 < 300ms
objective: 95.0
threshold: 300.0
- slo_type: error
title: P99 < 1% errors
objective: 99.0
threshold: 1.0
---
title: 5% packet loss for 4s
description: Simulates flaky Wi-Fi or cellular interference.
items:
- call:
method: GET
url: http://localhost:9090/
timeout: 500
meta:
operation_id: read_root__get
context:
upstreams:
- http://localhost:9090/
faults:
- type: packetloss
direction: egress
period: start:30%,duration:40%
strategy: null
expect:
status: 200
response_time_under: 100.0
---
title: High jitter (±80ms @ 8Hz)
description: Emulates bursty uplink, measuring buffering robustness.
items:
- call:
method: GET
url: http://localhost:9090/
meta:
operation_id: read_root__get
context:
upstreams:
- http://localhost:9090/
faults:
- type: jitter
amplitude: 80.0
frequency: 8.0
direction: ingress
side: server
strategy: null
expect:
status: 200
---
title: 512 KBps bandwidth cap
description: Models throttled 3G link; validates handling of large payloads.
items:
- call:
method: GET
url: http://localhost:9090/
meta:
operation_id: read_root__get
context:
upstreams:
- http://localhost:9090/
faults:
- type: bandwidth
rate: 512
unit: KBps
direction: ingress
strategy:
mode: load
duration: 15s
clients: 2
rps: 1
expect:
status: 200
```
You can run this scenario file agains the demo server:
```bash
fault demo run
```
To execute the scenario file, run the following command:
```bash
fault scenario run --scenario scenario.yaml
```
## JSON Schema
Below is the full JSON schema of the scenario file:
```json title="scenario-schema.json"
{
"$ref": "#/$defs/Scenario",
"$defs": {
"Scenario": {
"title": "Scenario",
"type": "object",
"properties": {
"title": {
"type": "string"
},
"description": {
"anyOf": [
{
"type": "string"
},
{
"type": "null"
}
]
},
"scenarios": {
"type": "array",
"items": {
"$ref": "#/$defs/ScenarioItem"
}
},
"config": {
"anyOf": [
{
"type": "null"
},
{
"$ref": "#/$defs/ScenarioGlobalConfig"
}
],
"default": null
}
},
"required": [
"title",
"description",
"scenarios"
]
},
"ScenarioItem": {
"title": "ScenarioItem",
"type": "object",
"properties": {
"call": {
"$ref": "#/$defs/ScenarioItemCall"
},
"context": {
"$ref": "#/$defs/ScenarioItemContext"
},
"expect": {
"anyOf": [
{
"type": "null"
},
{
"$ref": "#/$defs/ScenarioItemExpectation"
}
],
"default": null
}
},
"required": [
"call",
"context"
]
},
"ScenarioItemCall": {
"title": "ScenarioItemCall",
"type": "object",
"properties": {
"method": {
"type": "string"
},
"url": {
"type": "string"
},
"headers": {
"anyOf": [
{
"type": "object",
"additionalProperties": {
"type": "string"
}
},
{
"type": "null"
}
]
},
"body": {
"anyOf": [
{
"type": "string"
},
{
"type": "null"
}
]
},
"timeout": {
"anyOf": [
{
"type": "number"
},
{
"type": "null"
}
],
"default": null
},
"meta": {
"anyOf": [
{
"type": "null"
},
{
"$ref": "#/$defs/ScenarioItemCallOpenAPIMeta"
}
],
"default": null
}
},
"required": [
"method",
"url",
"headers",
"body"
]
},
"ScenarioItemCallOpenAPIMeta": {
"title": "ScenarioItemCallOpenAPIMeta",
"type": "object",
"properties": {
"operation_id": {
"anyOf": [
{
"type": "string"
},
{
"type": "null"
}
],
"default": null
}
},
"required": []
},
"ScenarioItemContext": {
"title": "ScenarioItemContext",
"type": "object",
"properties": {
"upstreams": {
"type": "array",
"items": {
"type": "string"
}
},
"faults": {
"type": "array",
"items": {
"$ref": "#/$defs/FaultConfiguration"
}
},
"strategy": {
"anyOf": [
{
"type": "null"
},
{
"anyOf": [
{
"$ref": "#/$defs/ScenarioRepeatItemCallStrategy"
},
{
"$ref": "#/$defs/ScenarioLoadItemCallStrategy"
}
],
"discriminator": {
"propertyName": "type",
"mapping": {
"ScenarioRepeatItemCallStrategy": "#/$defs/ScenarioRepeatItemCallStrategy",
"ScenarioLoadItemCallStrategy": "#/$defs/ScenarioLoadItemCallStrategy"
}
}
}
]
},
"slo": {
"anyOf": [
{
"type": "array",
"items": {
"$ref": "#/$defs/ScenarioItemSLO"
}
},
{
"type": "null"
}
],
"default": null
}
},
"required": [
"upstreams",
"faults",
"strategy"
]
},
"FaultConfiguration": {
"title": "FaultConfiguration",
"type": "object",
"properties": {
"Latency": {
"$ref": "#/$defs/Latency"
},
"PacketLoss": {
"$ref": "#/$defs/PacketLoss"
},
"Bandwidth": {
"$ref": "#/$defs/Bandwidth"
},
"Jitter": {
"$ref": "#/$defs/Jitter"
},
"Blackhole": {
"$ref": "#/$defs/Blackhole"
},
"HttpError": {
"$ref": "#/$defs/HttpError"
}
},
"required": [
"Latency",
"PacketLoss",
"Bandwidth",
"Jitter",
"Blackhole",
"HttpError"
]
},
"Latency": {
"title": "Latency",
"type": "object",
"properties": {
"distribution": {
"anyOf": [
{
"type": "string"
},
{
"type": "null"
}
]
},
"global_": {
"anyOf": [
{
"type": "boolean"
},
{
"type": "null"
}
]
},
"mean": {
"anyOf": [
{
"type": "number",
"minimum": 0.0
},
{
"type": "null"
}
]
},
"stddev": {
"anyOf": [
{
"type": "number",
"minimum": 0.0
},
{
"type": "null"
}
]
},
"min": {
"anyOf": [
{
"type": "number",
"minimum": 0.0
},
{
"type": "null"
}
]
},
"max": {
"anyOf": [
{
"type": "number",
"minimum": 0.0
},
{
"type": "null"
}
]
},
"shape": {
"anyOf": [
{
"type": "number",
"minimum": 0.0
},
{
"type": "null"
}
]
},
"scale": {
"anyOf": [
{
"type": "number",
"minimum": 0.0
},
{
"type": "null"
}
]
},
"side": {
"anyOf": [
{
"enum": [
"client",
"server"
]
},
{
"type": "null"
}
],
"default": "server"
},
"direction": {
"anyOf": [
{
"enum": [
"egress",
"ingress"
]
},
{
"type": "null"
}
],
"default": "ingress"
},
"sched": {
"anyOf": [
{
"type": "string",
"pattern": "(?:start:\\s*(\\d+s|\\d+m|\\d+%)(?:,)?;?)*(?:duration:\\s*(\\d+s|\\d+m|\\d+%)(?:,)?;?)*"
},
{
"type": "null"
}
],
"default": null
}
},
"required": [
"distribution",
"global_",
"mean",
"stddev",
"min",
"max",
"shape",
"scale"
]
},
"PacketLoss": {
"title": "PacketLoss",
"type": "object",
"properties": {
"side": {
"anyOf": [
{
"enum": [
"client",
"server"
]
},
{
"type": "null"
}
],
"default": "server"
},
"direction": {
"anyOf": [
{
"enum": [
"egress",
"ingress"
]
},
{
"type": "null"
}
],
"default": "ingress"
},
"sched": {
"anyOf": [
{
"type": "string",
"pattern": "(?:start:\\s*(\\d+s|\\d+m|\\d+%)(?:,)?;?)*(?:duration:\\s*(\\d+s|\\d+m|\\d+%)(?:,)?;?)*"
},
{
"type": "null"
}
],
"default": null
}
},
"required": []
},
"Bandwidth": {
"title": "Bandwidth",
"type": "object",
"properties": {
"rate": {
"type": "integer",
"minimum": 0,
"default": 1000
},
"unit": {
"enum": [
"bps",
"gbps",
"kbps",
"mbps"
],
"default": "bps"
},
"side": {
"anyOf": [
{
"enum": [
"client",
"server"
]
},
{
"type": "null"
}
],
"default": "server"
},
"direction": {
"anyOf": [
{
"enum": [
"egress",
"ingress"
]
},
{
"type": "null"
}
],
"default": "ingress"
},
"sched": {
"anyOf": [
{
"type": "string",
"pattern": "(?:start:\\s*(\\d+s|\\d+m|\\d+%)(?:,)?;?)*(?:duration:\\s*(\\d+s|\\d+m|\\d+%)(?:,)?;?)*"
},
{
"type": "null"
}
],
"default": null
}
},
"required": []
},
"Jitter": {
"title": "Jitter",
"type": "object",
"properties": {
"amplitude": {
"type": "number",
"minimum": 0.0,
"default": 20.0
},
"frequency": {
"type": "number",
"minimum": 0.0,
"default": 5.0
},
"side": {
"anyOf": [
{
"enum": [
"client",
"server"
]
},
{
"type": "null"
}
],
"default": "server"
},
"direction": {
"anyOf": [
{
"enum": [
"egress",
"ingress"
]
},
{
"type": "null"
}
],
"default": "ingress"
},
"sched": {
"anyOf": [
{
"type": "string",
"pattern": "(?:start:\\s*(\\d+s|\\d+m|\\d+%)(?:,)?;?)*(?:duration:\\s*(\\d+s|\\d+m|\\d+%)(?:,)?;?)*"
},
{
"type": "null"
}
],
"default": null
}
},
"required": []
},
"Blackhole": {
"title": "Blackhole",
"type": "object",
"properties": {
"direction": {
"enum": [
"egress",
"ingress"
],
"default": "egress"
},
"side": {
"anyOf": [
{
"enum": [
"client",
"server"
]
},
{
"type": "null"
}
],
"default": "server"
}
},
"required": []
},
"HttpError": {
"title": "HttpError",
"type": "object",
"properties": {
"body": {
"anyOf": [
{
"type": "string"
},
{
"type": "null"
}
]
},
"status_code": {
"$ref": "#/$defs/HTTPStatus",
"default": 500
},
"probability": {
"type": "number",
"minimum": 0.0,
"maximum": 1.0,
"default": 1.0
}
},
"required": [
"body"
]
},
"HTTPStatus": {
"title": "HTTPStatus",
"description": "",
"enum": [
100,
101,
102,
103,
200,
201,
202,
203,
204,
205,
206,
207,
208,
226,
300,
301,
302,
303,
304,
305,
307,
308,
400,
401,
402,
403,
404,
405,
406,
407,
408,
409,
410,
411,
412,
413,
414,
415,
416,
417,
418,
421,
422,
423,
424,
425,
426,
428,
429,
431,
451,
500,
501,
502,
503,
504,
505,
506,
507,
508,
510,
511
]
},
"ScenarioRepeatItemCallStrategy": {
"title": "ScenarioRepeatItemCallStrategy",
"type": "object",
"properties": {
"type": {
"enum": [
"ScenarioRepeatItemCallStrategy"
]
},
"mode": {
"enum": [
"repeat"
]
},
"step": {
"type": "number",
"minimum": 0.0
},
"failfast": {
"anyOf": [
{
"type": "boolean"
},
{
"type": "null"
}
]
},
"wait": {
"anyOf": [
{
"type": "number",
"minimum": 0.0
},
{
"type": "null"
}
]
},
"add_baseline_call": {
"anyOf": [
{
"type": "boolean"
},
{
"type": "null"
}
]
},
"count": {
"type": "integer",
"minimum": 0,
"default": 0
}
},
"required": [
"type",
"mode",
"step",
"failfast",
"wait",
"add_baseline_call"
]
},
"ScenarioLoadItemCallStrategy": {
"title": "ScenarioLoadItemCallStrategy",
"type": "object",
"properties": {
"type": {
"enum": [
"ScenarioLoadItemCallStrategy"
]
},
"mode": {
"enum": [
"load"
]
},
"duration": {
"type": "string"
},
"clients": {
"type": "integer",
"minimum": 0
},
"rps": {
"type": "integer",
"minimum": 0
}
},
"required": [
"type",
"mode",
"duration",
"clients",
"rps"
]
},
"ScenarioItemSLO": {
"title": "ScenarioItemSLO",
"type": "object",
"properties": {
"type": {
"type": "string"
},
"title": {
"type": "string"
},
"objective": {
"type": "number"
},
"threshold": {
"type": "number"
}
},
"required": [
"type",
"title",
"objective",
"threshold"
]
},
"ScenarioItemExpectation": {
"title": "ScenarioItemExpectation",
"type": "object",
"properties": {
"status": {
"anyOf": [
{
"type": "integer",
"minimum": 0
},
{
"type": "null"
}
]
},
"response_time_under": {
"anyOf": [
{
"type": "number",
"minimum": 0.0
},
{
"type": "null"
}
]
}
},
"required": [
"status",
"response_time_under"
]
},
"ScenarioGlobalConfig": {
"title": "ScenarioGlobalConfig",
"type": "object",
"properties": {
"http": {
"anyOf": [
{
"type": "null"
},
{
"$ref": "#/$defs/ScenarioHTTPGlobalConfig"
}
],
"default": null
}
},
"required": []
},
"ScenarioHTTPGlobalConfig": {
"title": "ScenarioHTTPGlobalConfig",
"type": "object",
"properties": {
"headers": {
"type": "object",
"additionalProperties": {
"type": "string"
}
},
"paths": {
"anyOf": [
{
"type": "null"
},
{
"$ref": "#/$defs/HTTPPathsConfig"
}
],
"default": null
}
},
"required": [
"headers"
]
},
"HTTPPathsConfig": {
"title": "HTTPPathsConfig",
"type": "object",
"properties": {
"segments": {
"type": "object",
"additionalProperties": {
"type": "string"
}
}
},
"required": [
"segments"
]
}
}
}
```
## Next Steps
- **Learn how to [generate](../how-to/scenarios/generate.md)** scenarios.
# Proxy Fault Scheduling Intervals
fault provides a simple, yet flexible, syntax to schedule faults with intervals.
By defining these intervals, you can create richer scenarios that resemble more
real-life network conditions.
## What is an interval?
Each network fault takes a flag to declare such scheduling. When unset, the
fault runs continuously from start to finish.
An interval is made of two tokens:
* a starting point: determines when the fault should be apply by fault
* a duration: defines how long this fault should be run for
When the starting point is unset, fault takes this as "run from the beginning".
When no duration is set, fault understand you want to run from the given
starting point all the way to the end.
To create multiple intervals, you can repeat these as many times as your
scenario requires.
### Fixed vs Relative
An interval may be fixed or relative. A fixed interval uses concrete time units,
such as a seconds or minutes. These are independant from how long the proxy
runs for. Relative intervals uses percentages of the total duration of the
run. They explicitely require that the user defines a total duration via
the `--duration` flag.
Relative intervals are powerful because the stretch or shrink withe the
declared duration. That means these intervals are more portable.
## Grammar
The schedule grammar is a tiny DSL. Below is its EBNF grammar:
```ebnf
schedule = period *(";" period) ;
period = start_clause [ "," duration_clause ] | duration_clause ;
start_clause = "start" ":" time_spec ;
duration_clause= "duration" ":" time_spec ;
time_spec = fraction | duration ;
fraction = integer "%" ;
duration = integer time_unit ;
time_unit = "ms" | "s" | "m" | "h" | "d" | "w"
integer = DIGIT { DIGIT } ;
DIGIT = "0" | "1" | "2" | "3" | "4"
| "5" | "6" | "7" | "8" | "9" ;
```
## Examples
Here are a few examples:
**Fixed interval**
```bash
--latency-sched "start:30s;duration:3m"
```
**Fixed intervals With Many Fauts**
```bash
--latency-sched "start:30s;duration:3m" --packet-loss-sched "start:2m;duration:25s"
```
**Fixed interval full duration**
```bash
--latency-sched "start:30s"
```
**Fixed interval limited duration**
```bash
--latency-sched "duration:50s"
```
**Fixed intervals**
```bash
--latency-sched "start:30s;duration:3m;start:4m,duration:45s"
```
**Mixed intervals**
```bash
--latency-sched "start:30s;duration:3m;start:4m"
```
**Mixed relative/fixed intervals**
```bash
--duration 5m --latency-sched "start:30s;duration:3m;start:90%,duration:5%"
```
**Relative intervals**
```bash
--duration 5m --latency-sched "start:5%;duration:30%;start:90%,duration:5%"
```
# Creating a Reliability Testing Scenario
## Introduction
**Context**:
Modern applications are not running in isolation. Whether it is a distributed
file system, a database or a remote API, applications depend on network to
be reliable and fast.
Understanding how an application reacts under network duress is prime to build
more resilient systems overall.
**Goal**:
By the end of this tutorial, you will:
- Configure fault to apply latency.
- Run a defined scenario that systematically applies this fault.
- Observe the application’s behavior and interpret the resulting report.
!!! tip
In this guide, you will learn how to create a scenario manually, but
if you are targetting a HTTP service that exposes an OpenAPI specification,
fault will help you generate scenarios
automatically.
## Prerequisites
**Tools & Setup**:
- fault [installed](../how-to/install.md) on your local machine.
- An existing application or a simple test client that makes calls to a known
third-party endpoint (e.g., `https://api.example.com`).
- Basic familiarity with setting `HTTP_PROXY` or `HTTPS_PROXY` environment
variables.
**Assumptions**:
The tutorial assumes you have followed the
[Getting Started](./getting-started.md) tutorial and understand how to launch
fault proxy.
## Step 1: Choosing the Third-Party Endpoint
Before simulating any faults, it’s essential to establish a reliable baseline.
This step ensures that your application can communicate successfully with a
stable API, so you know that any issues observed later are truly due to the
injected faults.
### How to Pick a Stable Endpoint
- **Reachability:**
fault supports HTTP/1.1 and HTTP/2 only. If your endpoint only responds to
HTTP/3, fault cannot work with it.
- **Consistency:**
Select an endpoint known for its consistency. A public API that rarely experiences
downtime is ideal.
- **Predictability:**
The endpoint should return predictable responses, making it easier to spot the impact
of any simulated network faults.
For demonstration purposes, use `http://localhost:7070`.
## Step 2: Creating a Scenario File
In this step, you'll create a scenario file in YAML that defines a series of
tests. Each scenario acts like a mini-test case, telling fault exactly how to
simulate network faults and what to expect from your application. This file is
your blueprint for reliability engineering.
Follow these steps to build your scenario file:
### Define User-Centric Metadata
- **Title:**
Every scenario starts with a clear title. This gives you a quick reference for
what the test is about.
- **Description:**
Optionally, add a short description for extra context about the scenario.
Example:
```yaml
---
title: "Latency Increase By 30ms Steps From Downstream"
description: "A collection of tests to evaluate how our service handles network faults."
```
### Define a Scenario Test
Each item in the scenarios array represents one test case. It must contain three
parts:
**Call:**
This section defines the HTTP request that fault will make.
- `method`: The HTTP method (GET, POST, etc.).
- `url`: The full URL to call.
- `headers`: An object with header key-value pairs (if needed).
- `body`: The request payload (if needed).
```yaml
call:
method: GET
url: http://localhost:7070/ping
```
**Context:**
This section tells fault which upstream services are involved and which faults
to inject.
- `upstreams`: An array of endpoints (as strings) where faults should be applied.
- `faults`: An array of fault configurations. The JSON schema defines the
structure for each fault type (Latency, PacketLoss, Bandwidth, etc.).
- `strategy`: (Optional) Defines how to repeat the test with incremental changes
(for example, gradually increasing latency).
```yaml
context:
upstreams:
- https://postman-echo.com
faults:
- type: latency
mean: 80
stddev: 5
direction: ingress
side: server
strategy:
mode: repeat
step: 30
count: 3
add_baseline_call: true
```
The `add_baseline_call` property is useful when you want to make a first call
to your application without applying any faults. This provides a very basic
baseline record of your application in normal conditions.
The test declares that traffic going to upstream `https://postman-echo.com`
will be routed to the proxy and that latency will be applied to ingress traffic
from this endpoint.
!!! note
The reason we are using this server here is because the demo application
provided by fault makes a call to it when the `/ping` endpoint is called.
**Expect:**
This section specifies the criteria that determine whether the test has passed.
`status`: The expected HTTP status code (or null).
`response_time_under`: The maximum allowed response time (in milliseconds).
```yaml
expect:
status: 200
response_time_under: 490
```
**Putting it all together:**
```yaml
---
title: "Latency Increase By 30ms Steps From Downstream"
description: "A collection of tests to evaluate how our service handles network faults."
items:
- call:
method: GET
url: http://localhost:7070/ping
context:
upstreams:
- https://postman-echo.com
faults:
- type: latency
mean: 80
stddev: 5
direction: ingress
side: server
strategy:
mode: repeat
step: 30
count: 3
add_baseline_call: true
expect:
status: 200
response_time_under: 490
```
## Step 3: Configuring Your Application and Environment
Before running your fault injection scenarios, it's crucial to ensure that
traffic to and from your application is routed via fault's proxy.
### Set the Proxy Environment Variable
Configure your environment so that all HTTPS traffic is routed through fault.
This is typically done by setting the `HTTP_PROXY` and/or `HTTPS_PROXY`
environment variable to point to fault's proxy endpoint.
- **On Linux/MacOS/Windows (WSL):**
```bash
export HTTP_PROXY=http://127.0.0.1:3180
export HTTPS_PROXY=http://127.0.0.1:3180
```
- **On Windows:**
```command
set HTTP_PROXY=http://127.0.0.1:3180
set HTTPS_PROXY=http://127.0.0.1:3180
```
or using Powershell:
```powershell
$env:HTTP_PROXY = "http://127.0.0.1:3180"
$env:HTTPS_PROXY = "http://127.0.0.1:3180"
```
## Step 4: Running the Scenario
Now that you’ve defined your scenarios and configured your environment,
it’s time to run the tests and see fault in action.
### Run the Scenario
Execute the following command in your terminal:
```bash
fault scenario run --scenario scenario.yaml
```
!!! tip
You may pass a directory instead of a single file, fault will process all
of them as part of a single run.
Here is the output of the run:
```console
================ Running Scenarios ================
⠦ 4/4 [00:00:01] Latency Increase By 30ms Steps From Downstream ▮▮▮▮ [GET http://localhost:7070/ping]
===================== Summary =====================
Tests run: 4, Tests failed: 1
Total time: 1.9s
Report saved as report.json
```
!!! note
We have 4 iterations even though we set the iteration count to `3` in the
scenario. This is due to the fact we also added a baseline call first with
the parameter `add_baseline_call: true`.
### What’s Happening Behind the Scenes
**Proxy Launch:**
- fault starts a local proxy server (by default at `http://127.0.0.1:3180`) to
intercept and manipulate network traffic.
**Fault Injection:**
- For each test defined in your scenario file, fault applies the specified
network faults.
**Metrics and Logging:**
- As the tests run, fault captures detailed metrics (like response times,
status codes, and error occurrences) along with logs. All this data is then
saved to `scenario-report.json` for later analysis.
## Step 5: Observing Logs and Output
fault records metrics while running the scenario. You can use this information
to analyse the way your application reacted to increasingly degraded network
conditions.
fault produces two files:
- `results.json` Represents the structured log of the scenario execution.
Notably, it shows the faults as they were applied
- `report.json` Represents an automated analysis of the run. fault applies some
heuristics to evaluate what would be the impact on a variety of service-level
objectives (SLO)
### Run Metrics
Here is an example of `results.json` file:
```json
{
"start": 1747072156,
"end": 1747072158,
"results": [
{
"scenario": {
"title": "Latency Increase By 30ms Steps From Downstream",
"description": "A collection of tests to evaluate how our service handles network faults.",
"items": [
{
"call": {
"method": "GET",
"url": "http://localhost:7070/ping"
},
"context": {
"upstreams": [
"https://postman-echo.com"
],
"faults": [
{
"type": "latency",
"side": "server",
"mean": 80.0,
"stddev": 5.0,
"direction": "ingress"
}
],
"strategy": {
"mode": "repeat",
"step": 30.0,
"count": 3,
"add_baseline_call": true
}
},
"expect": {
"status": 200,
"response_time_under": 490.0
}
}
]
},
"results": [
{
"target": {
"address": "http://localhost:7070/ping"
},
"results": [
{
"start": 1747072156512117,
"expect": {
"type": "http",
"wanted": {
"status_code": 200,
"response_time_under": 490.0,
"all_slo_are_valid": null
},
"got": {
"status_code": 200,
"response_time": 462.121729,
"all_slo_are_valid": null,
"decision": "success"
}
},
"metrics": {
"dns": [
{
"host": "localhost",
"duration": 0.095075,
"resolved": true
}
],
"protocol": {
"type": "http",
"code": 200,
"body_length": 308
},
"ttfb": 0.00177,
"total_time": 462.121729,
"faults": [
{
"url": "localhost:7070",
"applied": [
{
"event": {
"type": "latency",
"direction": "ingress",
"side": "client",
"delay": 84.615696
}
}
]
}
],
"errored": false,
"timed_out": false
},
"faults": [
{
"type": "latency",
"side": "client",
"mean": 80.0,
"stddev": 5.0,
"direction": "ingress"
}
],
"errors": []
},
{
"start": 1747072156987144,
"expect": {
"type": "http",
"wanted": {
"status_code": 200,
"response_time_under": 490.0,
"all_slo_are_valid": null
},
"got": {
"status_code": 200,
"response_time": 460.167284,
"all_slo_are_valid": null,
"decision": "success"
}
},
"metrics": {
"dns": [
{
"host": "localhost",
"duration": 0.050846,
"resolved": true
}
],
"protocol": {
"type": "http",
"code": 200,
"body_length": 308
},
"ttfb": 0.003175,
"total_time": 460.167284,
"faults": [
{
"url": "localhost:7070",
"applied": [
{
"event": {
"type": "latency",
"direction": "ingress",
"side": "client",
"delay": 77.726423
}
}
]
}
],
"errored": false,
"timed_out": false
},
"faults": [
{
"type": "latency",
"side": "client",
"mean": 80.0,
"stddev": 5.0,
"direction": "ingress"
}
],
"errors": []
},
{
"start": 1747072157452249,
"expect": {
"type": "http",
"wanted": {
"status_code": 200,
"response_time_under": 490.0,
"all_slo_are_valid": null
},
"got": {
"status_code": 200,
"response_time": 448.75748,
"all_slo_are_valid": null,
"decision": "success"
}
},
"metrics": {
"dns": [
{
"host": "localhost",
"duration": 0.051273,
"resolved": true
}
],
"protocol": {
"type": "http",
"code": 200,
"body_length": 307
},
"ttfb": 0.003145,
"total_time": 448.75748,
"faults": [
{
"url": "localhost:7070",
"applied": [
{
"event": {
"type": "latency",
"direction": "ingress",
"side": "client",
"delay": 72.084749
}
}
]
}
],
"errored": false,
"timed_out": false
},
"faults": [
{
"type": "latency",
"side": "client",
"mean": 80.0,
"stddev": 5.0,
"direction": "ingress"
}
],
"errors": []
},
{
"start": 1747072157910258,
"expect": {
"type": "http",
"wanted": {
"status_code": 200,
"response_time_under": 490.0,
"all_slo_are_valid": null
},
"got": {
"status_code": 200,
"response_time": 479.741817,
"all_slo_are_valid": null,
"decision": "success"
}
},
"metrics": {
"dns": [
{
"host": "localhost",
"duration": 0.078204,
"resolved": true
}
],
"protocol": {
"type": "http",
"code": 200,
"body_length": 308
},
"ttfb": 0.002776,
"total_time": 479.741817,
"faults": [
{
"url": "localhost:7070",
"applied": [
{
"event": {
"type": "latency",
"direction": "ingress",
"side": "client",
"delay": 79.378289
}
}
]
}
],
"errored": false,
"timed_out": false
},
"faults": [
{
"type": "latency",
"side": "client",
"mean": 80.0,
"stddev": 5.0,
"direction": "ingress"
}
],
"errors": []
}
],
"requests_count": 4,
"failure_counts": 0,
"total_time": {
"secs": 1,
"nanos": 886894730
}
}
]
}
]
}
```
### Report Analysis
fault is able to generate a report for you when running the scenario. By
default, it will serialize it to JSON. Alternatively, you may change this to
YAML or Markdown. fault will select the right format based on the extension
of the report file. For instance, we could have executed the scenario as
follows:
```bash
fault scenario run --scenario scenario.yaml --report report.md
```
!!! example "Scenario report"
# Scenarios Report
Start: 2025-05-13 06:11:34.262257729 UTC
End: 2025-05-13 06:11:36.746793078 UTC
## Scenario: Latency Increase By 30ms Steps From Downstream (items: 4)
_Description:_ A tests to evaluate how our service handles network faults.
### 🎯 `GET` http://localhost:7070/ping | Failed
**Call**:
- Method: `GET`
- Timeout: -
- Headers: -
- Body?: No
**Strategy**: repeat 3 times with a step of 30
**Faults Applied**:
- Latency: ➡️🖧, Per Read/Write Op.: false, Mean: 80.00 ms, Stddev: 5.00 ms
**Expectation**: Response time Under 490ms | Status Code 200
**Run Overview**:
| Num. Requests | Num. Errors | Min. Response Time | Max Response Time | Mean Latency (ms) | Expectation Failures | Total Time |
|-----------|---------|--------------------|-------------------|-------------------|----------------------|------------|
| 4 | 0 (0.0%) | 401.56 | 955.63 | 450.99 | 1 | 2 seconds and 407 ms |
| Latency Percentile | Latency (ms) | Num. Requests (% of total) |
|------------|--------------|-----------|
| p25 | 413.50 | 2 (50.0%) |
| p50 | 450.99 | 3 (75.0%) |
| p75 | 829.88 | 4 (100.0%) |
| p95 | 955.63 | 4 (100.0%) |
| p99 | 955.63 | 4 (100.0%) |
---
## Step 6: Identifying Areas for Improvement
Now that you’ve run your scenarios, it’s time to take a close look at the
results and ask yourself: How did your application really perform under these
simulated network conditions? Questions you may ask about your service:
**Latency Handling:**
Did your application gracefully manage the injected latency, or did some
requests time out?
**Error Handling and Retries:**
Although these examples focus on latency, think about how your system would
respond to more disruptive faults. Are your
error-handling and retry mechanisms robust enough to recover gracefully?
**Bandwidth Constraints:**
Consider how the application behaves under limited bandwidth scenarios.
Would a throttled connection significantly affect user experience or internal
performance?
### Detailed Breakdown
**Test 1: Baseline Call (No Fault Injected)**
- **Response Time:** 391.25ms
- **Expected:** Under 490ms
- **Outcome:** **Success**
*Your service handled the request quickly under ideal conditions.*
**Test 2: Latency Fault with Mean 80ms**
- **Injected Fault:** Latency fault with a mean of 80ms
- **Response Time:** 382.47ms
- **Expected:** Under 490ms
- **Outcome:** **Success**
*The slight increase in latency was within acceptable limits.*
**Test 3: Latency Fault with Mean 110ms**
- **Injected Fault:** Latency fault with a mean of 110ms
- **Response Time:** 434.31ms
- **Expected:** Under 490ms
- **Outcome:** **Failure**
*A higher increase in latency was within acceptable limits.*
**Test 4: Latency Fault with Mean 140ms**
- **Injected Fault:** Latency fault with a mean of 140ms
- **Response Time:** 655.48ms
- **Expected:** Under 490ms
- **Outcome:** **Failure**
*The response time further degraded, confirming that higher latency critically impacts performance.*
### Interpreting the Results
- **Performance Sensitivity:**
The baseline and initial fault test (80ms mean) indicate your application
performs well under slight latency. However, when the latency increases beyond
a certain point (110ms and 140ms), the response time quickly escalates,
leading to failures.
- **Threshold Identification:**
These results help you pinpoint the latency threshold where your application
begins to struggle. Knowing this, you can set realistic performance targets
and optimize system behavior for expected network conditions.
- **Insight into Resilience:**
The incremental steps in fault injection reveal exactly how your system's
performance degrades. This information is crucial for making targeted
improvements. For instance, refining retry logic, adjusting timeouts, or
optimizing resource management.
### Next Steps Based on These Insights
- **Investigate Bottlenecks:**
Analyze why your service handles up to 80ms latency successfully but fails at
higher levels. This could be due to slow dependencies, inefficient error
handling, or suboptimal timeouts.
- **Enhance Fault Tolerance:**
Consider implementing circuit breakers or adaptive retry mechanisms that kick
in as latency increases.
- **Iterate and Test:**
Use these insights to further refine your scenarios. Adjust the fault
parameters and re-run tests to see if your improvements yield the desired
performance enhancements.
## Conclusion
In this tutorial, you learned how to:
- **Define and run a scenario:**
You created a scenario file to simulate multiple network faults:
latency, bandwidth constraints, and error injections.
- **Observe real-world impact:**
By running your scenarios, you observed how your application behaves under
stress. The collected metrics and logs provided clear evidence of its
strengths and weaknesses.
- **Gather actionable data:**
The insights from the test reports guided you in identifying areas for
performance optimization and error handling improvements.
By integrating these practices into your development cycle, you can catch issues
earlier in the process. The goal is to help your application to become more
resilient and production-ready. This proactive approach not only improves overall
system reliability but also paves the way for a smoother, more confident path to
production.
## Next Steps
- **Discover our [How-To Guides](../how-to/scenarios/generate.md)** to explore
fault's capabilities and how to apply them.
- **Generate scenarios from [OpenAPI specifications](../how-to/scenarios/generate.md#generate-scenarios-from-an-openapi-specification)**.
# Getting Started with fault
Welcome to fault! Your new ally in exploring and understanding the impact of
these petty network issues on your application.
In this brief tutorial, we’ll help you get up and running with fault so that you
can start experimenting with network faults and latency right from your own
environment.
By the end of this tutorial, you’ll have:
- Installed fault on your machine.
- Started a local proxy to simulate network conditions.
- Started a local demo application for learning purpose
- Made your first request through the proxy, observing how latency affects the
application.
Let’s get started!
## Prerequisites
Before diving in, make sure you have the following:
- **A supported operating system:** fault runs smoothly on most modern Linux,
macOS, and Windows systems.
!!! note
Enabled features may vary on each platform, you may look at the
[features matrix](../how-to/install.md#features-matrix)
to understand which are available based on your system. For the
purpose of this tutorial, all platforms are good to go!
## Step 1: Installation
If you haven’t installed fault yet, please follow the
[installation guide](../how-to/install.md).
## Step 2: Starting the Local Proxy
fault operates by running a local proxy server. You can route your application’s
traffic through it to simulate network faults. Let’s start a simple latency
scenario:
```bash
fault run --upstream http://localhost:7070 --with-latency --latency-mean 300
```
This command launches the fault proxy on a local port
(by default, `127.0.0.1:3180`) and injects an average of `300ms` latency into
outgoing requests. You can adjust the `--latency-mean` value to experiment with
different latencies.
The `--upstream http://localhost:7070` argument tells fault to only process
traffic from and to this host.
!!! failure
Note, if you see an error with a mesage such as
`Os { code: 98, kind: AddrInUse, message: "Address already in use" }`, it is
a signe that another process is listening on the same address.
!!! tip
Always remember to set the right upstream server address that matches the
endpoints you are exploring. You can set many `--upstream` arguments.
Any traffic received by fault that does not match any of these
upstream addresses will go through the proxy unaltered.
Once started, the proxy should issue the following message:
 Notice how the output tells you the address of the proxy server to use from
your clients.
You are now ==ready to roll!==
## Step 3: Starting a demo application
For the purpose of this tutorial, we will use a demo application built-in
into fault.
Start the demo application in a different terminal:
```bash
fault demo run
```
This will start an application and listen for HTTP requests on
`http://localhost:7070`.
This will output the following prelude:
Notice how the output tells you the address of the proxy server to use from
your clients.
You are now ==ready to roll!==
## Step 3: Starting a demo application
For the purpose of this tutorial, we will use a demo application built-in
into fault.
Start the demo application in a different terminal:
```bash
fault demo run
```
This will start an application and listen for HTTP requests on
`http://localhost:7070`.
This will output the following prelude:
 The demo describes which endpoints are available and how to call them.
First, you can verify the demo is running correctly with `curl`:
```bash
curl http://localhost:7070
```
which should output:
```html
The demo describes which endpoints are available and how to call them.
First, you can verify the demo is running correctly with `curl`:
```bash
curl http://localhost:7070
```
which should output:
```html
Hello, World!
```
Look at the demo application output and you should see the request was served:
```
GET / 200 6.627µs
```
The given timing `6.627µs` represents the duration of the request/response
processing by the demo application for that particular request.
Let's now enrich the `curl` command above to output the time taken from the
client's perspective:
```bash hl_lines="2"
curl -I -o /dev/null -s \
-w "Connected IP: %{remote_ip}:%{remote_port}\nTotal time: %{time_total}s\n" \
http://localhost:7070
```
This should display something such as:
```text
Connected IP: 127.0.0.1:7070
Total time: 0.000239s
```
The time is displayed in seconds. Here the response took `239µs`.
Let's now move to the next stage, inducing latency impacting the client's
point of view of the time taken to receive a response from the demo application.
## Step 4: Configuring Your Application to Use the Proxy
Now that fault's running, configure your application's
HTTP requests to pass through the proxy.
For example, if you're using `curl`, you might do:
```bash hl_lines="3"
curl -I -o /dev/null -s \
-w "Connected IP: %{remote_ip}:%{remote_port}\nTotal time: %{time_total}s\n" \
-x http://127.0.0.1:3180 \
http://localhost:7070
```
With `-x http://127.0.0.1:3180` set, all requests made via `curl` will flow
through fault, experiencing the specified latency. By observing your
application’s behavior (whether it’s a command-line tool, a local service, or
a browser hitting a test endpoint), you’ll gain first-hand insight into how
network slowdowns affect it.
!!! tip
Most of the time, you can set either the `HTTP_PROXY` or `HTTPS_PROXY`
environment variables to let your client know it needs to go through
a proxy: `export HTTP_PROXY=http://127.0.0.1:3180`.
Once you have executed that command, you should see a much higher response
time:
```json
Connected IP: 127.0.0.1:3180
Total time: 0.333350s
```
We are now above the `300ms` mark as per the configuration of our proxy.
Fantastic, you have now succeeded in altering the perception
your clients would have from your using your application. The only question
remaining is whether or not this is a level that is acceptable by the
organisation.
## Step 5: Observing the Effects
Trigger a few requests from your application. Notice how responses now arrive
slightly delayed. This delay simulates real-world network conditions.
- If your application times out or behaves strangely under these conditions,
you’ve just uncovered a resilience gap.
- If it gracefully handles delayed responses, congratulations! Your software
is a step closer to being truly reliable.
## Next Steps
You’ve successfully set up fault, run your first latency
scenario, and routed traffic through it. What’s next?
- **Try different latency values or other fault injection parameters** to get
a feel for how your application responds to varied conditions.
- **Explore our [Scenario Tutorial](./create-scenario.md)** to learn how to
simulate scenarios using files and generate detailed reports.
- **Dive into [How-To Guides](../how-to/proxy/faults/configure-latency.md)** to integrate
- fault deeper into your workflow, from automated
- testing to continuous integration.
With this initial setup under your belt, you’re well on your way to embracing
a culture of resilience in your everyday development tasks. Happy experimenting!
# Install fault
fault strives to get out of your way and it starts with a smooth installation.
## Download fault
fault is provided as a binary targetting the three major platforms: Linux,
macOS and Windows.
You may try the installation script:
```bash
curl -sSL https://fault-project.com/get | bash
```
Alternatively, explore our other [installation options](../how-to/install.md#download-the-fault-binary).
## Check fault is ready to roll
Let's verify it all went well by running the following command:
```bash
fault --help
```
This should output the following:
```console
A proxy to test network resilience by injecting various faults.
Usage: fault [OPTIONS]
Commands:
run Resilience Proxy
inject Resilience Fault Injection
scenario Resilience Automation
agent Resilience Agentic Buddy
demo Run a simple demo server for learning purpose
help Print this message or the help of the given subcommand(s)
Options:
-h, --help Print help
-V, --version Print version
Logging Options:
--log-file Path to the log file. Disabled by default [env: FAULT_LOG_FILE=]
--log-stdout Stdout logging enabled [env: FAULT_WITH_STDOUT_LOGGING=]
--log-level Log level [env: FAULT_LOG_LEVEL=] [default: info]
Observability Options:
--with-otel Enable Open Telemetry tracing and metrics. [env: FAULT_WITH_OTEL=]
```
## Troubleshooting
If you receive a message such as ̀`fault: No such file or directory`, it likely
means you have not put the directory containing the `fault` binary in your
`PATH`, or you may need to restart your session for the changes to take
effect.
## Next Steps
You’ve successfully downloaded and installed fault. What’s next?
- **Explore our [Getting Started Tutorial](./getting-started.md)** to learn how to first use fault.
- **Dive into [How-To Guides](../how-to/proxy/faults/configure-latency.md)** to integrate fault deeper into
your workflow, from automated testing to continuous integration.
# tl;dr
## Overview
fault comes with the following main capabilities in one CLI.
* Fault Injection: operation oriented features
* AI Agent: LLM-based features
* Easy platform injection
```mermaid
---
config:
theme: 'forest'
---
mindmap
root((fault CLI))
Fault Injection
Proxy
Network
LLM
Database
Scenario
AI Agent
Review
MCP
Platform
Kubernetes
AWS
GCP
```
## Getting started with fault injection
The core of fault is its fault injection engine. It
allows you to:
- [X] Inject faults into your services
Run `fault run` to start injecting network failures
- [X] Automate these failures into YAML files that can be run from your CI
Run `fault scenario generate` and `fault scenario run` to create
YAML-based scenarios that can be stored alongside your code and executed
from your CI.
## Getting started with fault injection for LLM
The core of fault is its fault injection engine. It
offers a nice way to inject LLM-specific faults into your your LLM calls:
- [X] Inject faults into your services making calls to LLM providers
Run `fault run llm` to start injecting LLM faults
## Getting started with platform injection
fault makes it easy to inject itself into
your platform so you can easily explore faults there as well.
- [X] Inject faults into your favourite platform
Run `fault inject` to start injecting faults
## Getting started with the AI Agent
If you are keen to get started with the AI-agent, the general steps are as
follows:
- [X] Pick up your favorite LLM
fault supports OpenAI, Gemini, OpenRouter and ollama.
If you use any of the cloud-based LLMs, you will need to generate an API
key. If you want privacy, go with ollama.
- [X] Configure your AI-Code editor
[Setup the editor](../how-to/agent/llm-configuration.md) of your choice so
it knows how to find fault as a MCP server. Most of the time it's by adding
a `mcpServers` object somewhere in their settings file.
## Next Steps
* **Start exploring our [tutorials](getting-started.md)** to gently get into using fault.
* **Explore our [How-To guides](../how-to/proxy/faults/configure-latency.md)** to explore fault's features.